


Reading candlestick charts means understanding how price moved during a specific time period by analyzing the candle’s body and wicks. Stock candlestick patterns help traders identify trend direction, buying pressure, selling pressure, and potential reversals using visual price behavior.
Key Takeaways
- Reading candlestick charts helps traders understand price movement quickly.
- Stock candlestick patterns reveal market sentiment.
- Bullish and bearish candlesticks show buying or selling pressure.
- Candlestick chart analysis works best with trend context.
- Technical analysis candlesticks require confirmation before trading.
What Is a Candlestick?
A candlestick is a visual representation of price movement over a specific period. It can represent one minute, one hour, one day, or any timeframe.
Each candle shows four important prices:
- Open
- High
- Low
- Close
These four points form the structure of the candle.
In candlestick trading basics, understanding this structure is the first step.
Parts of a Candlestick
Every candlestick has two main parts:
- The Body: The thick part between open and close.
- The Wicks (Shadows): Thin lines showing high and low prices.
If the close is above the open, the candle is bullish.
If the close is below the open, the candle is bearish.
Bullish and bearish candlesticks give quick insight into who controlled the session, buyers or sellers.
For traders who want to understand how candlestick behavior reflects broader market changes (like when a bearish market becomes bullish), and how price structure shifts from lower lows to higher highs, this concept is explained in more detail in this article:
See “When Does a Bearish Market Become Bullish in Forex?” on Defcofx
Bullish and Bearish Candlesticks Explained
A bullish candlestick means buyers pushed the price higher than where it opened. It usually appears green or white on most charts.
A bearish candlestick means sellers pushed the price lower than where it opened. It usually appears red or black.
In reading candlestick charts, the size of the body matters. A large bullish body shows strong buying pressure. A large bearish body shows strong selling pressure.
Small bodies often signal indecision in the market.
Why Candlestick Chart Analysis Is Important
Candlestick chart analysis helps traders understand:
- Market psychology
- Trend strength
- Reversal signals
- Entry and exit timing
Technical analysis candlesticks are visual tools. Instead of reading numbers, traders read price behavior.
When multiple candles form recognizable shapes, they create stock candlestick patterns that can signal future price direction.
4 Common Stock Candlestick Patterns (With Clear Examples)
Here are some important candlestick trading basic patterns that traders use to read market sentiment and potential reversals.
1. Doji
A Doji forms when the opening price and closing price are nearly the same, creating a very small or non-existent body.
What it means: It signals indecision between buyers and sellers. Neither side was able to gain control during that session.
Example: A stock has been rising for several days. Suddenly, a Doji appears near a resistance level. Buyers pushed prices up, sellers pushed them down, and the session closed almost where it opened. This often warns that momentum may be weakening and a pause or reversal could follow.
2. Hammer
A Hammer has a small body near the top of the candle and a long lower wick. It typically appears after a downtrend.
What it means: It signals a potential bullish reversal. Sellers pushed prices lower, but buyers stepped in strongly and closed the price near the opening level.
Example: A stock has been declining for several sessions. During the next session, the price drops sharply but then recovers and closes near the high of the day. This hammer shows buyers defending lower prices, suggesting selling pressure may be ending.
3. Shooting Star
A Shooting Star has a small body near the bottom of the candle and a long upper wick. It usually appears after an uptrend.
What it means: It signals a potential bearish reversal. Buyers pushed prices higher, but sellers took control and forced the close back down.
Example: After a strong rally, a stock opens and surges higher but then sells off sharply before closing near the open. The long upper wick shows rejection of higher prices, warning that buying momentum may be fading.
4. Engulfing Pattern
An engulfing pattern involves two candles and comes in two types:
- Bullish Engulfing: A large bullish candle fully covers (engulfs) the previous bearish candle.
- Bearish Engulfing: A large bearish candle fully covers the previous bullish candle.
What it means: It signals a strong shift in control from one side of the market to the other.
Example (Bullish Engulfing): After a short downtrend, a small red candle forms. The next session opens lower but rallies strongly and closes well above the previous candle’s high. This shows buyers overpowering sellers and often marks the start of an upward move.
Example (Bearish Engulfing): After an uptrend, a small green candle is followed by a large red candle that closes below the prior candle’s low, signaling sellers have taken control.
How to Start Reading Candlestick Charts Step by Step
To begin reading candlestick charts, follow this simple process:
1) Identify the Trend Direction First
Before you look for patterns, determine whether price is moving:
- Uptrend: higher highs + higher lows
- Downtrend: lower highs + lower lows
- Range: price bouncing between support and resistance
Why it matters: Candlestick signals work best when they align with the broader trend or appear at key levels.
2) Read the Most Recent Candles (Size + Color)
Focus on the last 10–30 candles and ask:
- Are candles getting bigger (strong momentum) or smaller (slowing momentum)?
- Are bullish candles closing near their highs (buyers strong)?
- Are bearish candles closing near their lows (sellers strong)?
Tip: Large bodies usually show strong control. Small bodies often show hesitation or a possible turning point.
3) Check the Wicks (Rejection Clues)
Wicks tell you where price was rejected:
- Long lower wick: buyers defended lower prices (support reaction)
- Long upper wick: sellers rejected higher prices (resistance reaction)
This helps you understand who tried to push the price and who resisted.
4) Spot Bullish or Bearish Patterns
Look for patterns like
- Doji (indecision)
- Hammer (possible bullish reversal after a drop)
- Shooting Star (possible bearish reversal after a rise)
- Engulfing (strong shift in control)
Important: Patterns have more meaning when they form near support/resistance, trendlines, or moving averages.
5) Confirm With Context (Volume + Indicators)
If volume is available:
- Higher volume during a breakout or reversal strengthens the signal.
- Low volume can mean the move is weak or unreliable.
Then confirm with 1–2 simple tools (don’t overload charts), like:
- Support & Resistance (most important)
- Moving Average (trend filter)
- RSI (momentum / overbought-oversold confirmation)
6) Plan the Trade (Entry, Stop, Exit)
Even if you’re not “trading” yet, learn to think in structure:
- Entry idea: after confirmation, the candle closes
- Stop-loss idea: beyond the wick or beyond the key level
- Target idea: next resistance/support zone
This turns candlestick reading into a repeatable process instead of guessing.
Key Reminder
Candlestick chart analysis should always consider the overall trend. A bullish pattern inside a strong downtrend may fail without confirmation—especially if it forms away from support or lacks volume/momentum confirmation.
Understanding Trend Context
Technical analysis candlesticks work differently depending on trend direction.
In an uptrend:
- Bullish patterns tend to be more reliable.
- Bearish signals may indicate short-term pullbacks.
In a downtrend:
- Bearish patterns are stronger.
- Bullish signals may indicate temporary bounces.
Trend context is essential in candlestick trading basics.
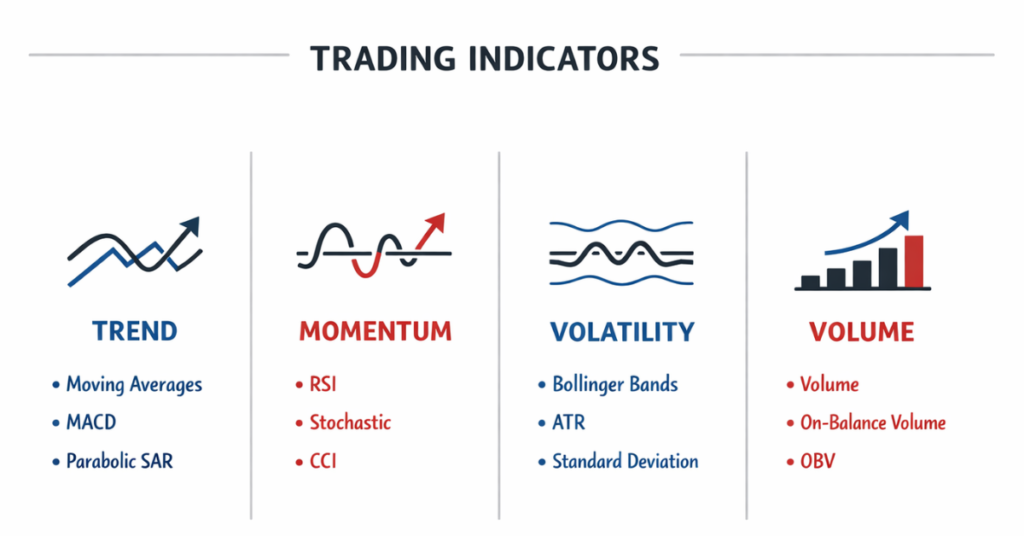
Candlestick Patterns vs Indicators
Both candlestick patterns and technical indicators help traders analyze the market, but they serve different purposes. The table below highlights their key differences:
| Feature | Candlestick Patterns | Technical Indicators |
| What They Show | Immediate price action behavior (buyer vs seller control) | Mathematical calculations based on past price data |
| Type of Signal | Visual and pattern-based | Formula-driven and data-based |
| Speed of Reaction | Immediate (forms in real time) | Often slightly delayed (lagging indicators) |
| Best Used For | Reversal signals, rejection levels, short-term sentiment | Trend confirmation, momentum strength, overbought/oversold conditions |
| Examples | Doji, Hammer, Engulfing, Shooting Star | Moving Averages, RSI, MACD, Volume |
| Strength | Clear and intuitive visual interpretation | Objective confirmation and structure |
| Weakness | Can give false signals without context | Can lag or give late entries |
How They Work Together
Candlestick patterns show what price is doing right now, while indicators help confirm whether that move has strength behind it.
Example of Alignment
A bullish engulfing pattern forms at a key support level.
At the same time:
- RSI is rising from oversold territory
- Volume increases
- Price is near a rising moving average
This alignment strengthens the probability of a successful trade setup.
How Volume Enhances Candlestick Signals
Volume shows how many shares were traded during a period. High volume confirms strength behind a move.
If a bullish candlestick forms with high volume, buying pressure is likely strong. If volume is weak, the move may not last.
Reading candlestick charts without considering volume can lead to false signals.
Timeframes and Candlestick Reading
Candlestick chart analysis can be done on different timeframes:
- 1-minute charts (short-term trading)
- Hourly charts (intraday trading)
- Daily charts (swing trading)
- Weekly charts (long-term analysis)
Higher timeframes often provide stronger stock candlestick patterns because they filter out short-term noise.
Beginners often find daily charts easier to understand.
Psychology Behind Candlesticks
Technical analysis candlesticks reflect market emotion.
A large bullish candle shows confidence. A large bearish candle shows fear. A doji shows uncertainty.
Every candle tells a story about buyers and sellers. When you combine multiple candles, you see a bigger picture of market behavior.
Candlestick trading basics are rooted in understanding this psychology.
Example of Reading a Candlestick Setup
Imagine a stock that is already in a clear uptrend (forming higher highs and higher lows). After a strong upward move, price pulls back toward a known support level.
At that support level, a hammer candlestick forms:
- The lower wick is long (showing sellers pushed price down)
- The body closes near the top of the candle (showing buyers regained control)
This suggests buyers are defending the support area.
The Confirmation Step
The next day, a strong bullish candlestick forms, and
- Closes above the hammer’s high
- Has a large body
- Shows increased volume
This confirms that buyers have stepped back in with strength.
Why This Setup Matters
This sequence shows three important elements:
- Trend Context: The overall trend is upward.
- Support Reaction: Price respected a key level.
- Momentum Confirmation: The bullish candle breaks above the hammer’s high with strong volume.
When these factors align, the probability of trend continuation increases.
Defined Risk in This Setup
One reason traders like this structure is because risk can be clearly defined:
- Entry idea: After the bullish candle closes above the hammer’s high
- Stop-loss idea: Below the hammer’s low
- Target idea: Previous high or next resistance level
This creates a logical trade plan instead of an emotional decision.
Final Thoughts: How to Read Stock Candlesticks
Learning how to read stock candlesticks is a foundational skill in trading. Stock candlestick patterns help traders understand buying and selling pressure visually. Through candlestick chart analysis, traders identify trend strength, potential reversals, and entry timing.
Mastering bullish and bearish candlesticks, combining them with volume, and applying technical analysis candlesticks within a trend context improves decision-making and trading discipline over time.
Frequently Asked Questions
What are stock candlestick patterns?
Stock candlestick patterns are formations created by one or more candles on a price chart. They help traders understand market sentiment and potential future price direction. Common patterns include doji, hammer, and engulfing formations.
How do beginners start reading candlestick charts?
Beginners should first learn candlestick trading basics by understanding open, high, low, and close prices. Then practice identifying bullish and bearish candlesticks and simple patterns on daily charts before moving to shorter timeframes.
Are bullish and bearish candlesticks reliable?
Bullish and bearish candlesticks can be reliable when used within proper trend context and confirmed by volume or other indicators. Relying on one candle alone may lead to false signals.
What is candlestick chart analysis used for?
Candlestick chart analysis is used to identify trends, reversals, entry points, and market psychology. It is a core component of technical analysis candlesticks in stock trading.
Can candlestick trading basics be applied to all markets?
Yes, candlestick trading basics apply to stocks, forex, crypto, and commodities. Since they represent price movement visually, the concept works across different financial markets.