


The best technical indicators for day trading blend trend, momentum, volatility and volume tools notably EMA/SMA, RSI, MACD, Bollinger Bands, VWAP and ATR. Use two to three complementary indicators, tune them to your timeframe, and always backtest on a demo before risking real capital.
Key Takeaways
- Top indicators for day trading: EMA/SMA, RSI, MACD, Bollinger Bands, VWAP, ATR each serve a distinct purpose (trend, momentum, volatility, volume).
- Use 2–3 complementary indicators (trend + momentum + volume/volatility) to reduce false signals.
- Backtest and demo-trade every setup before going live; parameter tuning matters by asset and timeframe.
- Avoid indicator overlap (don’t use multiple indicators that show the same data).
- Combine indicators with strict risk management: position sizing, stop losses, and a clear entry/exit plan.
What Are Technical Indicators in Day Trading?
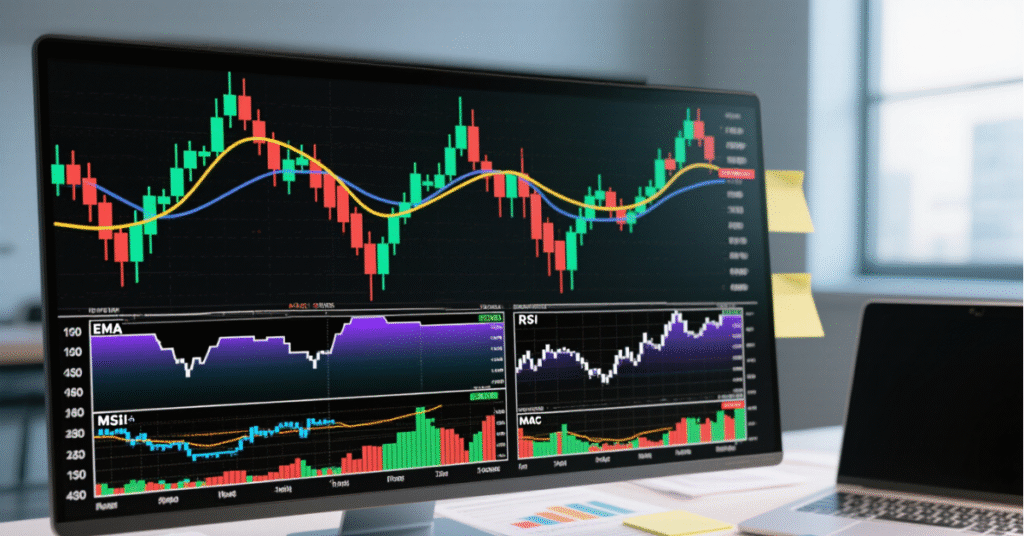
Technical indicators are mathematical tools that analyze price, volume, and momentum to help traders identify entry and exit points. For day trading, indicators are crucial because they interpret intraday data in real time, helping traders act quickly on short-term trends, reversals, and breakouts.
Unlike long-term investors who rely on fundamentals, day traders use indicators to make rapid decisions often holding trades for minutes or hours. These indicators visualize market behavior, showing patterns that aren’t easily seen on raw charts.
Types of Technical Indicators
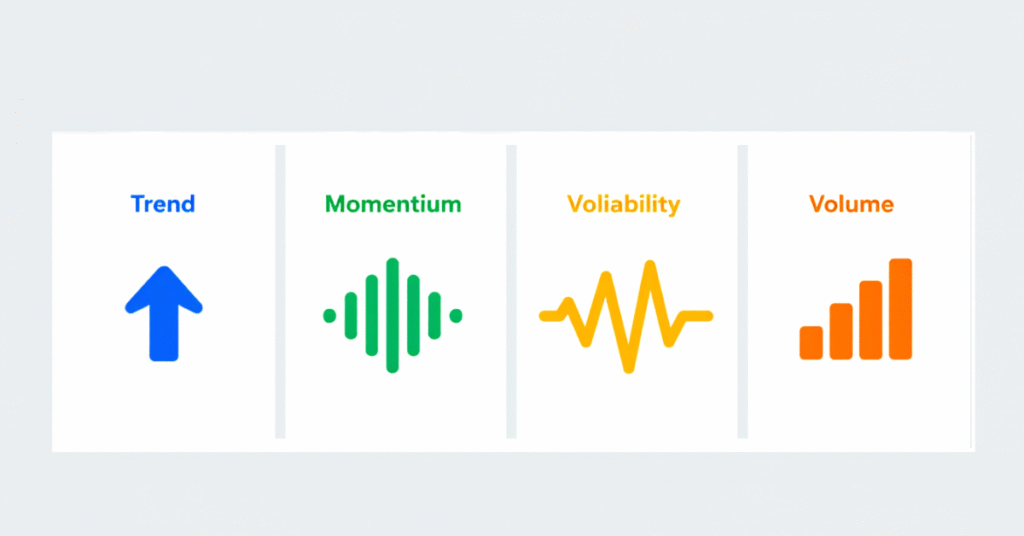
Day traders usually classify indicators into four key categories:
| Indicator Type | Purpose | Common Examples |
| Trend Indicators | Identify market direction | Moving Averages, MACD |
| Momentum Indicators | Measure strength or weakness of price movement | RSI, Stochastic Oscillator |
| Volatility Indicators | Gauge market fluctuation intensity | Bollinger Bands, ATR |
| Volume Indicators | Confirm price strength via trading activity | On-Balance Volume (OBV), VWAP |
How to Select the Right Indicators for Day Trading
Choosing the right technical indicators depends on your trading style, market, and timeframe. Each indicator serves a unique purpose: some identify the trend, others confirm momentum or volatility. The goal is to build a setup that aligns with your market behavior, not overwhelm your chart with signals.
4 Key Factors to Consider
- Market Type:
- Forex traders often prefer RSI, EMA, and ATR to gauge momentum and volatility.
- Stock traders might rely on VWAP and MACD for volume and trend confirmation.
- Crypto traders may use Bollinger Bands to detect sudden volatility spikes.
- Trading Timeframe:
- Short timeframes (1–5 minutes) need faster indicators like EMA (9/20) and Stochastic Oscillator.
- Longer intraday frames (15–60 minutes) work better with MACD, RSI, and VWAP for broader signals.
- Volatility Level:
- Highly volatile markets (crypto, commodities) need ATR and Bollinger Bands to manage stop-loss zones.
- Stable markets favor smoother indicators like SMA or RSI for cleaner signals.
- Avoiding Overlap:
- Many traders mistakenly use multiple indicators showing the same information for example, RSI, Stochastic, and CCI together.
- Instead, combine different types (e.g., trend + momentum + volume) for balanced confirmation.
Top 10 Best Technical Indicators for Day Trading
Here are the 10 most effective and widely used technical indicators for day traders. Each helps identify price direction, momentum, or volatility to make precise intraday decisions. Using the right mix of these tools improves timing and accuracy across forex, stocks, and crypto markets.
1. Moving Averages (SMA & EMA)
Purpose: Identify trend direction and potential reversals.
- SMA (Simple Moving Average): Smooths out price data to highlight overall trend.
- EMA (Exponential Moving Average): Reacts faster to price changes, ideal for short-term trading.
Common Use: Combine 9-EMA and 20-EMA crossovers to detect intraday trend shifts.
2. Relative Strength Index (RSI)
Purpose: Measures momentum and identifies overbought or oversold conditions.
- RSI above 70 = possible overbought zone; below 30 = potential oversold zone.
- Works well for spotting intraday reversals and divergence setups.
3. MACD (Moving Average Convergence Divergence)
Purpose: Reveals trend strength and reversal points.
- Based on two EMAs (usually 12 and 26).
- When the MACD line crosses above the signal line, it’s bullish; crossing below indicates bearish momentum.
- Works best on 15-minute or 30-minute charts.
4. Bollinger Bands
Purpose: Measure volatility and detect price breakouts.
- Composed of a middle SMA with upper and lower bands representing volatility range.
- When price touches or breaks above/below the bands, it often signals strong momentum or trend continuation.
5. VWAP (Volume Weighted Average Price)
Purpose: Shows the average trading price weighted by volume critical for intraday stock and forex traders.
- Price above VWAP = bullish sentiment; below VWAP = bearish sentiment.
- Institutional traders often use VWAP to benchmark entries and exits.
6. Fibonacci Retracement
Purpose: Identifies potential pullback or reversal levels.
- Key retracement zones: 38.2%, 50%, and 61.8%.
- Works best when combined with trend indicators like EMA or MACD to confirm reversal strength.
7. Stochastic Oscillator
Purpose: Tracks momentum and potential reversal zones.
- Shows where the price closed relative to its recent range.
- Signals reversals when %K crosses %D line (especially in overbought/oversold zones).
8. ATR (Average True Range)
Purpose: Measures market volatility and helps set stop losses or profit targets.
- High ATR = strong volatility; low ATR = quiet market.
- Use ATR-based stops (e.g., 1.5× ATR) to avoid premature exits.
9. On-Balance Volume (OBV)
Purpose: Confirms price moves through volume.
- Rising OBV = accumulation; falling OBV = distribution.
- A divergence between OBV and price often signals upcoming reversals.
10. Pivot Points
Purpose: Provide daily support and resistance levels for intraday trading.
- Calculated from the previous day’s high, low, and close.
- Frequently used by forex and futures traders to identify entry/exit zones.
Trend + Momentum + Volume setup (e.g., EMA + RSI + OBV) provides a balanced view of direction, strength, and participation.
Always test combinations before using them live.
Best Indicator Combinations by Market Type
Different markets behave differently meaning the same indicator setup won’t work everywhere. Day traders must adapt their tools based on market volatility, liquidity, and price movement characteristics. Below are the most effective indicator combinations tailored for Forex, Stocks, and Crypto trading.
Best Indicators for Forex Day Trading
Forex markets are highly liquid and react quickly to news, requiring tools that balance momentum and volatility.
Recommended combination:
- EMA (9 & 20) → Detects short-term trend shifts.
- RSI (14) → Measure overbought/oversold momentum.
- ATR (14) → Gauge volatility and set stop-loss targets.
How to use it: When EMA (9) crosses above EMA (20) and RSI rises above 50, confirm with moderate ATR for a valid bullish setup.
Best Indicators for Stock Day Trading
Stock prices move sharply with volume surges — volume and trend confirmation indicators are vital.
Recommended combination:
- VWAP → Determine fair intraday price and institutional activity.
- MACD (12,26,9) → Identify momentum shifts and reversals.
- Volume Profile or OBV → Confirm institutional participation.
How to use it: Enter long trades when price crosses above VWAP and MACD shows a bullish crossover supported by rising volume.
Best Indicators for Crypto Day Trading
Crypto markets run 24/7 with extreme volatility, demanding adaptive tools.
Recommended combination:
- Bollinger Bands → Identify volatility breakouts.
- RSI (14) → Confirm momentum direction.
- OBV → Validate breakout volume.
How to use it: Trade breakouts when price breaks outside the Bollinger Bands and RSI confirms trend strength (>60 or <40), supported by OBV volume increase.
Building a Day Trading Strategy with Indicators
Creating a profitable day trading strategy isn’t about stacking more indicators, it’s about combining complementary tools, testing setups, and maintaining strict discipline. Every indicator has strengths and limitations, so your strategy should balance trend detection, momentum confirmation, and risk control.
Step 1: Choose a Core Indicator (Trend Confirmation)
Start with a trend indicator like EMA (9 & 20) or MACD.
These reveal whether the market is trending upward, downward, or ranging.
- Uptrend: Price above both EMAs or MACD > 0
- Downtrend: Price below both EMAs or MACD < 0
Step 2: Add a Momentum Indicator (Entry Timing)
Use RSI or Stochastic Oscillator to confirm entry timing.
- Buy when momentum shows oversold recovery (RSI crossing 30–50).
- Sell when RSI falls below 70 with weakening momentum.
Step 3: Include a Volatility or Volume Indicator
Add ATR, Bollinger Bands, or OBV to measure volatility and confirm the strength of movement.
- ATR helps set stop-loss and take-profit distances.
- Bollinger Bands confirm if breakouts are statistically strong.
Step 4: Test on Demo Before Going Live
Backtest the strategy on historical charts, then forward-test it in a demo account for a few weeks.
- Keep a trading journal to record entries, exits, and emotions.
- Refine parameters like indicator length (e.g., 9 vs. 14 periods) for better performance.
Step 5: Apply Strict Risk Management
Even the best indicators fail occasionally. Always:
- Risk only 1–2% per trade.
- Use stop-loss orders tied to ATR or swing points.
- Maintain consistent position sizing relative to account equity.
5 Common Mistakes Traders Make with Indicators
Even experienced traders sometimes misuse indicators leading to false signals, premature exits, or missed opportunities. Recognizing these mistakes early can dramatically improve your consistency and risk control.
1. Using Too Many Indicators
Stacking multiple indicators on a single chart creates “analysis paralysis.”
When signals conflict, traders hesitate or overthink. Instead, use a maximum of 3–4 indicators one for trend, one for momentum, one for volume or volatility, and one for confirmation.
2. Ignoring Market Conditions
Indicators don’t perform equally well in all conditions.
- Trend indicators like Moving Averages fail in sideways markets.
- Oscillators like RSI give false signals during strong trends.
Always identify whether the market is trending or ranging before applying indicators.
3. Not Adjusting Indicator Settings
Default indicator settings aren’t “one-size-fits-all.”
Scalpers might prefer shorter timeframes (e.g., 9-period EMA) while swing day traders can use longer ones (20-50 EMA).
Fine-tune based on asset volatility and trading style.
4. Over Reliance on Indicators Alone
Indicators should support, not replace, your price action understanding.
Combine indicators with candlestick patterns, chart structure, and key support/resistance zones for accuracy.
5. Ignoring Risk Management
Even with perfect indicator setups, ignoring stop-loss or position sizing can wipe out profits.
Indicators can fail in unexpected volatility so risk management must always come first.
Best Practices for Using Technical Indicators Effectively
To get the most out of technical indicators in day trading, you need a structured, disciplined approach, not just the right tools. Successful traders follow certain best practices that blend technical precision, risk control, and strategic simplicity.
1. Keep It Simple
Use no more than three indicators that complement each other.
Example:
- EMA (Trend) → Confirms direction
- RSI (Momentum) → Identifies entry zones
- ATR (Volatility) → Sets realistic targets & stops
2. Align Indicators Across Timeframes
Before entering a trade, confirm that your indicators align on multiple timeframes:
- RSI & EMA agree on 5-min and 15-min charts → stronger setup
- Avoid trades when indicators show opposite signals on different timeframes
3. Backtest and Forward-Test Regularly
Backtest your setup on at least 100 historical trades to understand its win rate and risk-reward.
Then, forward-test it in a demo account for 2–3 weeks to validate performance in real-time conditions.
4. Combine with Price Action
Indicators lag behind price, so use them to confirm, not predict.
Support/resistance zones, chart patterns, and candlestick formations should always come first indicators to refine your timing.
5. Maintain Risk Discipline
Set stop-loss and take-profit levels based on ATR or recent swing highs/lows.
Risk a maximum of 1–2% per trade and never move your stop-loss out of emotion.
6. Optimize but Don’t Overfit
Small tweaks (like EMA 9→10) are fine, but don’t over-optimize your indicators for past data markets evolve, and setups that perform perfectly in backtests might fail in live conditions.
7. Choose a Broker That Supports Indicator-Based Trading
A good platform matters as much as your indicators.
Defcofx offers:
- High leverage up to 1:2000 for flexible position sizing
- No commissions or swap fees, keeping indicator-based scalping cost-effective
- Fast execution and withdrawals (within 4 business hours) for quick day trading results
Final Thoughts on Best Technical Indicators for Day Trading
The most effective day traders don’t rely on dozens of tools; they use a carefully selected mix of technical indicators that complement one another. Whether it’s blending a trend indicator like EMA with a momentum tool like RSI and a volatility gauge like ATR, the goal is to make smarter, faster decisions without overwhelming the chart. Success comes from using these indicators with discipline, consistent testing, and solid risk management.
Ultimately, the best indicators are only as good as the trader behind them. When applied with a clear plan and a reliable trading platform like Defcofx which offers fast execution, no commissions, and leverage up to 1:2000 these tools can give day traders the edge they need to navigate volatile markets confidently and profitably.
Open a Trading Live AccountFAQs on the Best Technical Indicators for Day Trading
The most effective indicators for day trading are EMA (Exponential Moving Average), RSI (Relative Strength Index), MACD, Bollinger Bands, and VWAP.
These cover trend direction, momentum, volatility, and price strength providing a complete trading picture.
A strong combination is EMA + RSI + ATR:
EMA tracks short-term trend direction
RSI signals momentum shifts
ATR defines stop-loss and target levels based on volatility
Ideally, use 2–4 indicators maximum. Too many can create conflicting signals and delay decisions. Focus on indicators that serve different purposes, not multiple tools showing the same data.
No single indicator is “most accurate.” Accuracy depends on market condition, asset type, and strategy.
No. Indicators are confirmation tools, not decision-makers.
Combine them with price action analysis, support/resistance, and volume insights for high-probability setups.