


The forex market on December 24, 2025 was defined by diverging central bank policies and thin holiday trading conditions. The U.S. Federal Reserve was increasingly expected to begin cutting interest rates in early 2026 after data showed unemployment rising to 4.6% and inflation falling to 2.7% – trends that strengthened market bets on Fed easing. In contrast, other major central banks took different paths: the Bank of England delivered a 25 bp “hawkish cut” to 3.75% in a close vote, the European Central Bank held its deposit rate steady at 2.0%, and the Bank of Japan surprised markets with a 0.25% rate hike (to 0.75%, a 30-year high). This policy divergence was a key theme, putting the U.S. dollar on the defensive while boosting European currencies.
With many markets partially closed for Christmas Eve, trading volumes were lighter and volatility subdued. Risk sentiment remained cautiously positive – U.S. equity indices hovered near record highs (though the anticipated year-end “Santa Claus rally” had not fully materialized). This generally risk-on mood, combined with the Fed’s dovish tilt, favored risk-sensitive currencies (like GBP and EUR) and weighed on safe-havens. The dollar extended its broad pullback, and the yen struggled to capitalize on the BoJ’s tightening due to profit-taking and carry-trade flows. Geopolitical news offered a modest tailwind to sentiment: for example, reports of progress in Russia-Ukraine peace talks improved the outlook, contributing to a gentle bid in pro-growth assets. Overall, the day’s tone was one of cautious optimism, with traders positioning for a weaker dollar going into year-end. In the sections below, we focus on three major pairs – EUR/USD, GBP/USD, and USD/JPY – detailing their fundamental drivers, technical setups, and short-term outlook as of December 24, 2025.
EUR/USD
Fundamental Background
EUR/USD extended its December rally, reflecting a softer USD and steady Eurozone outlook. On the U.S. side, economic data painted a mixed picture. Q3 GDP surprised to the upside at +4.3% (annualized), the fastest growth in two years, driven by robust consumer and business spending. However, other indicators tempered the dollar’s appeal: consumer confidence fell for a fifth straight month to its weakest since 2008 amid inflation worries, and durable goods orders and industrial production in late Q4 came in weaker than expected (orders down –2.2% vs –1.5% forecast). These soft data points effectively neutralized the positive GDP news, limiting any USD rally. Meanwhile, the Fed’s policy stance had decisively shifted – after a December rate cut, officials signaled openness to further easing in 2026 if the labor market continues to cool. In contrast, the Eurozone’s outlook was stable. The ECB kept rates unchanged at 2.00% in its December meeting and even upgraded its 2026 forecasts for growth and inflation, reinforcing expectations of policy hold (no imminent cuts). This narrowing policy gap (Fed easing vs. ECB steady) underpinned the euro’s strength. Additionally, political and trade factors favored the euro: U.S. policy uncertainty – including Trump administration tariffs and pressure on the Fed – have introduced structural concerns for the dollar, whereas the Eurozone faced no new disruptions. Even the geopolitical backdrop improved slightly (e.g. hints of Ukraine conflict de-escalation), boosting risk appetite and indirectly supporting EUR. Notably, the economic calendar on Dec 24 was light – with only U.S. jobless claims scheduled – so broader themes drove EUR/USD rather than any single data point.
Technical Analysis
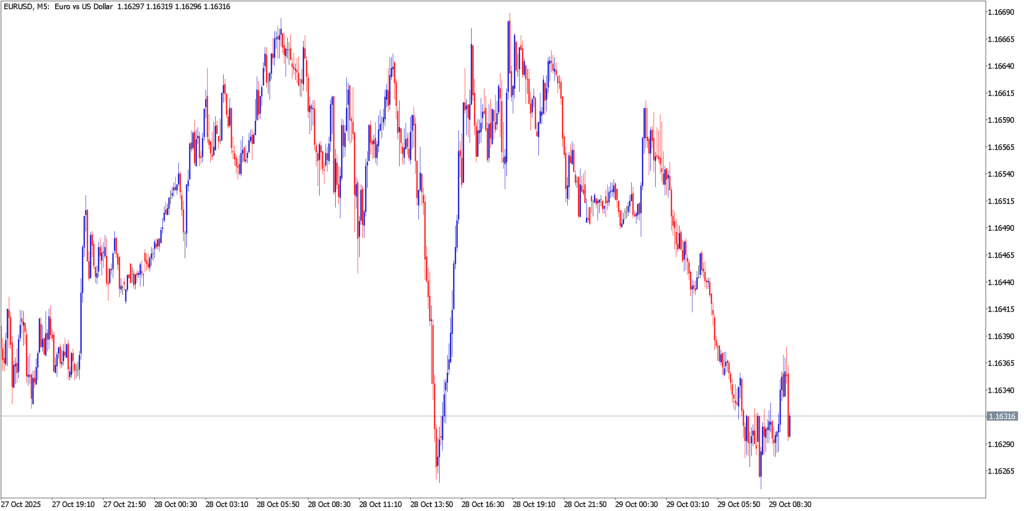
EUR/USD hourly chart shows the pair trading in an uptrend into Dec 24, with higher highs and higher lows evident. It tested a key resistance around 1.1795–1.1800 (blue zone) – a level corresponding to late-September highs – and briefly pulled back after an initial rejection. Notably, by Wednesday morning (Dec 24) the euro was again pressing the 1.18 handle, attempting a breakout on its second try. The 38.2% Fibonacci retracement of the November–December rally (around 1.1718, marked by the lower blue line) has acted as interim support on dips, underscoring the bullish trend structure. On the daily chart, EUR/USD’s technical posture is constructive: the pair climbed from a Nov 5 low ~1.1468 to around 1.18 by late December, decisively breaking above the 50-day EMA and a key neckline (around 1.1670) of an earlier inverted head-and-shoulders base. In fact, clearing 1.1670 turned that resistance into support, confirming a medium-term trend reversal. Momentum indicators are aligned with the bulls – the Relative Strength Index (RSI) and MACD on daily charts have been rising steadily, with no bearish divergences in sight. This indicates strengthening positive momentum. The path of least resistance appears upward: above 1.1800, the next significant target is the year-to-date high near 1.1915, which represents the peak from earlier in 2025. Conversely, if the euro fails to maintain traction above 1.18, initial support is seen at ~1.1715–1.1720 (the 38.2% Fib and recent swing low), followed by the 1.1640–1.1680 zone which includes the old neckline and 50% retracement. So far, any pullbacks have been shallow, reflecting buy-on-dips interest. Importantly, the short-term trend (as visible on H4/H1 charts) remains bullish, with the trendline support from early December intact and no major reversal candlesticks forming.
GBP/USD
Fundamental Background
GBP/USD surged to fresh multi-month highs, bolstered by both UK-specific factors and the global shift away from the dollar. Sterling’s strength was evident as it held above $1.35, marking its strongest level in over three years. A major catalyst was the Bank of England’s December meeting. On Dec 18, the BoE’s MPC voted 5–4 to cut the Bank Rate by 25 bps to 3.75%, a highly divided decision that analysts dubbed a “hawkish cut”. The tight vote (with four members preferring to hold rates) signaled the BoE’s reluctance to ease aggressively. Policymakers highlighted “sticky” services inflation (still ~3.2% core) as a concern, implying future rate cuts will be gradual. This cautious stance has provided a structural floor under the pound – markets perceive that the UK will not race to the bottom on rates, preserving a yield advantage for sterling. By contrast, the U.S. Federal Reserve has shifted to a defensive, dovish posture. At its Dec 10 meeting, the Fed cut rates to 3.50–3.75% and indicated readiness to support the economy amid a cooling labor market. Political pressure also looms, as the Trump administration’s 2025 trade policies (e.g. the April “Liberation Day” tariffs) have started to weigh on U.S. manufacturing. This policy divergence – BoE cautiousness vs. Fed accommodation – triggered what some called a “‘Sell America’ sentiment,” with capital flowing out of the dollar into the pound and euro. Indeed, sterling’s rally has been as much about broad USD weakness as UK strength. Analysts noted that the pound’s rise mirrors the dollar’s decline across the board (EUR, CHF, etc.), underscoring that USD softness is a primary driver.
Technical Analysis
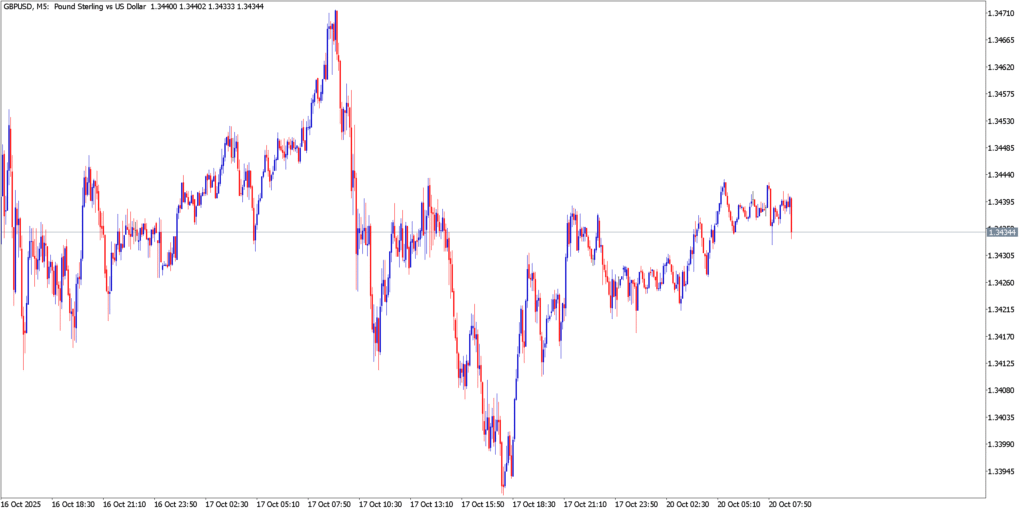
The rally accelerated in the lead-up to Dec 24, with cable breaking above the notable $1.3450 resistance zone (green line in chart) and surging to about 1.3515 at its peak. This level put GBP/USD near a 12-week high, reflecting strong bullish momentum. Importantly, the technical bias shifted firmly upward in December: on the daily timeframe, the 50-day EMA crossed above the 200-day EMA, forming a “golden cross” as the pair climbed. This bullish crossover underscores a positive trend change in medium-term momentum. Price action remains above both the 50-day and 100-day moving averages on H4/D1 charts, and the pair continues to trade within a gentle rising channel. The Relative Strength Index confirms the strength – on the 14-day RSI, sterling is hovering around 70, teetering into overbought territory which signals strong trend energy (though it also warns of possible near-term consolidation). Similarly, the MACD oscillator is deep in bullish territory, with no signs of an imminent crossover, indicating the uptrend’s momentum is intact. Chart-wise, support and resistance levels have shifted upward. The previous cap at 1.3450 (which coincided with late-Nov highs) has turned into immediate support, alongside the 1.3390–1.3400 area where minor pullbacks have been finding buyers. Below that, another support lies around 1.3320–1.3330 (the top of an earlier range in mid-Dec). On the upside, minor resistance from mid-December highs comes in at approximately 1.3545, followed by 1.3595–1.3600. Beyond those, bullish targets extend to 1.3650 (a level cited by technical analysts) and the year-to-date high near 1.3788. Notably, no major bearish reversal patterns (like head-and-shoulders or double tops) are present – instead, recent candles have mostly been bullish or neutral. The one point of caution is the overbought RSI ~70; while this reflects strong momentum, it could precede a short-term pause or slight pullback. Overall, however, the technical outlook remains firmly in favor of the bulls, with the golden cross and rising channel guiding the pair higher.
USD/JPY
Fundamental Background
USD/JPY experienced notable turbulence in mid-December as traders digested a major policy shift from the Bank of Japan. In a landmark move, the BoJ raised its benchmark interest rate by 0.25% to 0.75%, marking the highest Japanese rates since 1995. One might expect such tightening to strengthen the yen, but in practice the reaction was counterintuitive: the yen initially firmed on the announcement, but then sold off sharply, with USD/JPY climbing over 1.4% to around ¥157.7–¥158. Several factors explain this. First, the BoJ’s hike was widely anticipated – markets had largely priced it in – and Governor Ueda’s messaging disappointed hawks. He emphasized that policy would remain data-dependent and that the current rate was still below neutral, suggesting no aggressive follow-up hikes were guaranteed. This lack of a clear tightening trajectory led traders to resume shorting the yen, as the fundamental yield gap still heavily favors the dollar. In fact, even after the BoJ’s move, the interest rate differential means going long USD/JPY offers a positive carry (earning interest each day), which encourages carry trades that weaken the yen. Meanwhile, on the U.S. side, the Federal Reserve’s evolving stance would normally put downward pressure on USD/JPY – Fed easing typically helps the yen – but these effects are gradual. U.S. data has been mixed (strong GDP but higher unemployment, etc.), and traders expect Fed rate cuts in 2026, but in late 2025 the Fed had only just made its first cut. Thus, in the immediate term, the dollar retained yield support versus the yen. Additionally, intervention risk hung over the market: with USD/JPY near 158–159, Japanese officials (like Finance Minister Katayama) warned that excessive yen weakness was concerning. In past episodes (e.g. summer 2024), Japan intervened when USD/JPY neared the 160 level. This time, the mere specter of intervention made traders cautious about pushing the pair much higher, effectively capping the upside. Finally, general market sentiment played a role – late December saw strong equity markets and a lack of panic, reducing demand for the safe-haven yen. The risk-on backdrop (stocks near highs) meant the yen’s usual role as a refuge was muted. Taken together, these fundamentals kept USD/JPY in a tug-of-war: BoJ’s hawkish turn and Fed’s dovish turn favor yen strength, but yield differentials, carry trades, and risk appetite supported the dollar. The net result by Dec 24 was a range-bound market, with USD/JPY elevated relative to a month earlier, but off its post-BoJ spike highs as traders balanced these opposing forces.
Technical Analysis
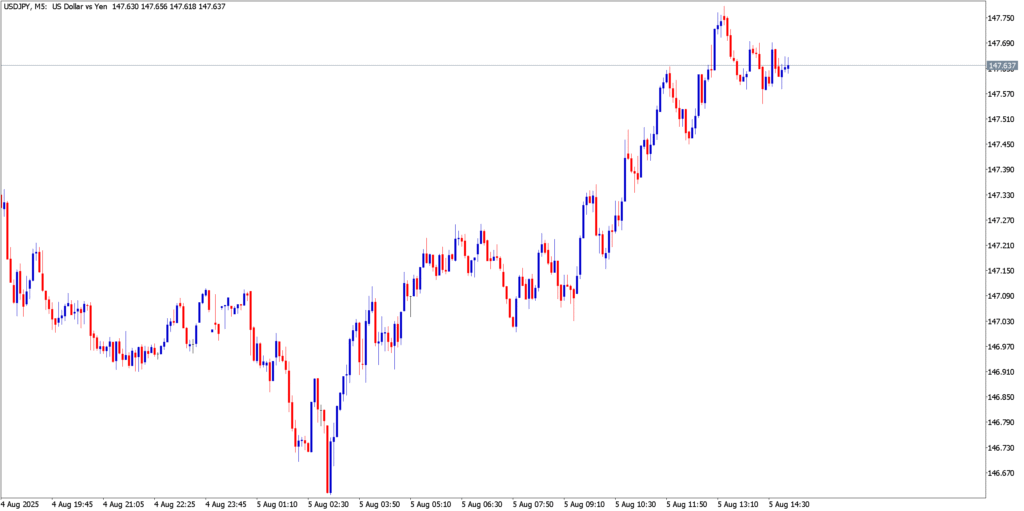
USD/JPY’s technical picture in late December showed signs of momentum exhaustion at the highs and the formation of a broad range. After rallying to ~157.8 following the BoJ meeting, the pair confronted a formidable resistance zone around 158.0–158.9. This area corresponds to the peak from November 20 and multiple earlier highs – essentially a triple-top region that has consistently repelled advances in 2025. True to form, the latest test in late December produced a bearish reversal: on the daily chart, a Dark Cloud Cover candlestick pattern emerged as USD/JPY failed to close above 158 and sellers took control. This pattern (where a black candlestick opens above a prior white candle’s high and closes below its midpoint) signaled waning bullish momentum. Additionally, price was rebuffed near the upper boundary of a rising channel (in place since April) and the upper Bollinger Band, indicating overextension. Following this reversal, technical indicators began to roll over. The RSI, which had ventured into overbought territory (>70) during the spike, started to decline, and shorter-term momentum gauges on 4H charts showed bearish divergences. With the uptrend paused, support levels came into focus. Initial support emerged around 155.0–155.5 (just below the 20-day moving average), but more significant is the 154.0–154.5 zone. Analysts identified ¥154.46 (approximately) as a key level – it’s the projected target from the dark cloud cover and coincides with previous wave lows. Indeed, as of Dec 24, USD/JPY was trading under mild pressure around 154.5 amid yen strength on intervention concerns. A drop below 154 could open the door to the next support at 153.7 and then the 152s, but so far buyers have defended the mid-153s on dips. Broadly, trend structure is at an inflection point: the long-term uptrend (higher highs since mid-2023) hasn’t officially broken, but a lower high at 158 (versus 159+ earlier in 2024) raises the possibility of a topping pattern. If USD/JPY cannot surpass 159 in future attempts, a double-top or distribution range might form. For now, the pair remains range-bound, with resistance firm at ~158–159 and support firm at ~153–154. The 20-day MA (~155.5) and 50-day MA (~152.5) are worth watching; the former has acted as a pivot (the recent rally sliced through it easily), and the latter lies near the bottom of the channel, offering deeper support if the correction extends. All in all, technical signals point to consolidation: the yen’s failure at resistance suggests more two-way action ahead, rather than a one-way trend.