


As we head into Wednesday, September 17, 2025, the FX market is on edge. Volatility is elevated with major central bank events looming (Fed and BoC rate decisions). The U.S. dollar is under intense focus: early trade shows USD/CAD rebounding near 1.3750 after a two-day slide, GBP/USD trading near multi-week highs amid broad dollar weakness, and USD/JPY testing key support around 146.20. In general, risk sentiment is cautious as investors digest Fed/BoC expectations and geopolitical headlines. (For example, USD/CAD “strengthens to near 1.3750” in European trade as markets price in Fed and BoC rate cuts.) Below, we break down technical trends for each pair and suggest clear trade ideas.
USD/CAD
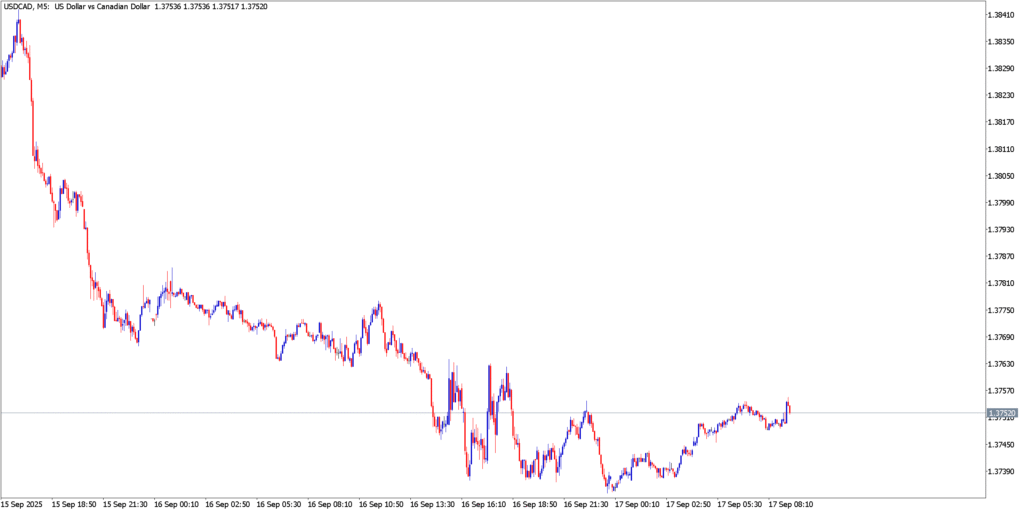
USD/CAD recently snapped a two-day decline, trading around 1.3750 in early Wednesday session. The trend has been driven by central banks: markets are pricing in a 25 bp cut by the Fed (expected Wed) and a BoC cut to 2.5% (today). This convergence of dovish policy has kept USD/CAD in a choppy range. Technically, momentum is shifting: the 5-min and daily MACD histograms have flattened and may be crossing higher, the RSI (14) has climbed off oversold levels (near 35–40), and Stochastic oscillators are turning upward from the low 20s. This suggests short-term bullish momentum off the lows. Key levels: resistance around 1.3770–1.3800 (recent highs), support near 1.3700.
- Buy above 1.3770: A break above this zone should target roughly 1.3820 and 1.3850, with an initial stop around 1.3740. (This follows through on the oversold bounce; keep risk tight since Fed news can reverse moves.)
- Sell below 1.3700: Conversely, failure of support at 1.3700 opens the way to ~1.3650 (the next congestion floor), with a stop about 1.3730.
In summary, look for a short-term bounce as USD/CAD holds above ~1.3700, but remain cautious of renewed weakness if the pair breaks that level. (FXStreet notes that USD/CAD’s snap-back was fueled by expectations of rate cuts.)
GBP/USD
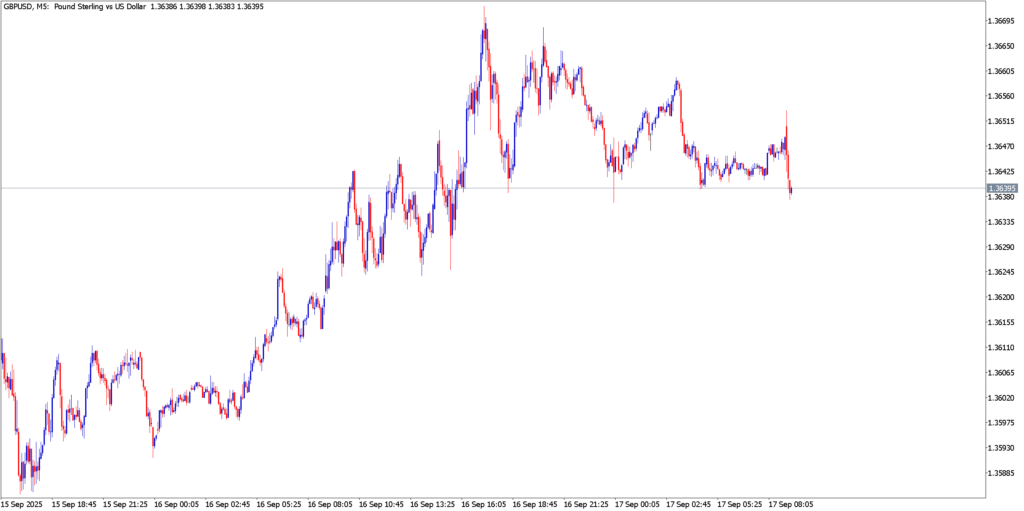
GBP/USD has trended higher recently, reflecting diverging central bank paths (BoE likely on hold vs. Fed easing) and lingering risk flows. The pair has formed an up-channel; on the daily chart the MACD is positive, RSI is in the mid-to-high 50s, and Stochastic is climbing toward overbought territory. This aligns with analysts’ views that a stronger pound is likely while the U.S. dollar is pressured. The technical outlook favors continuation of the rally so long as GBP/USD holds above its upward sloping MA. Key levels: near-term resistance at 1.3720–1.3750, support around 1.3610–1.3580.
- Buy above 1.3650: A clear move above 1.3650 (mid-channel) could see GBP/USD extend toward 1.3720–1.3750. Consider targets ~1.3720 and 1.3750, with a stop near 1.3620. (This trade follows the medium-term uptrend; analysts still favor longs to ~1.3723/1.3733 as long as price stays above the MA.)
- Sell below 1.3580: If GBP/USD breaks below the 1.3580 area, look for further declines toward 1.3510 or lower, placing a stop near 1.3620.
In summary, the bias is bullish, with traders likely to buy dips. Momentum indicators (MACD, RSI, Stoch) support the uptrend, but be wary if RSI runs above 70 or Stoch turns down. The FX.co analysis notes that “long positions targeting 1.3723 and 1.3733 remain much more relevant if the price is above [its moving average]”.
USD/JPY
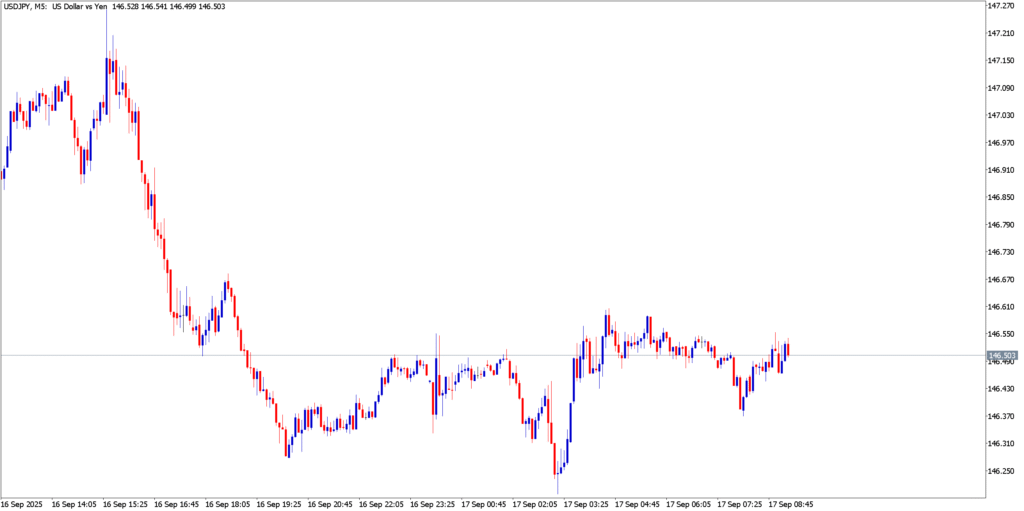
USD/JPY is showing weakness into mid-September. The pair recently broke below 147.00, settling at/around 147.20 as of early trade, and has tested the 146.20 area (its 100-day SMA). This reflects yen strength amid Fed dovishness. Technical indicators are bearish: on the daily chart MACD is below its signal line, RSI has fallen into the mid-30s, and Stochastic %K/%D are in oversold territory. The path of least resistance remains down. Key technical pivots: immediate support at 146.20 (100-day SMA) and then 146.00; below that the next targets are near 145.35 and the psychological 145.00. On the upside, resistance exists around 147.15–147.55; a sustained break above ~147.30–147.55 could test 148.00–148.75.
- Sell below 146.20: A break under 146.20 (100-day SMA) would confirm bearish momentum. In that case, target 145.50 then 145.00, with a stop around 146.70. (This aligns with FXStreet’s view that downside gains traction once 146.20 is broken.)
- Buy above 147.30: Only if USD/JPY clears 147.30 should one look for a rebound, targeting 148.00 (stop ~147.00). This would indicate a short-covering bounce; above 147.55 would open a run toward ~148.75.
In summary, USD/JPY remains bearish-biased. FXStreet highlights that breaking under 147.00 and holding 146.20 “was seen as a fresh trigger for the USD/JPY bears,” with oscillators favoring more downside. A daily close below 146.00 would reinforce that view, while only a decisive move above ~147.50 would shift the near-term outlook.
Market Outlook
Looking ahead, traders will monitor the Fed and BoC decisions (Wed) and BoE (Thu) closely. Key data include U.S. CPI, jobless claims, and Fed speeches; on the CAD side, oil prices and risk sentiment (Ukraine conflict, Asia risk) will matter. Overall risk appetite will swing on geopolitical headlines and central bank rhetoric. We expect continued whipsaw around major pair levels: investors should watch the 1.3750 zone in USD/CAD, the 1.3720–1.3750 ceiling in GBP/USD, and the 146.20–147.00 range in USD/JPY. As always, central bank surprises or shifts in global sentiment could trigger big moves, so position sizes and stops should be managed carefully.