


The forex market was thrown into turmoil on Friday, 17 October 2025, as trade war bombshells and rate cut fever sparked a rush to safety. The U.S. dollar stumbled to multi-week lows amid surging expectations of Federal Reserve rate cuts and renewed US–China trade tensions. Safe-haven assets like gold soared to record highs on the wave of risk aversion, while riskier currencies were pummeled. Global investors grappled with a potent mix of dovish central bank signals and geopolitical shockwaves – a combination that unleashed whipsaw volatility across major currency pairs.
The euro and pound surged to multi-day highs against the sliding dollar, capitalizing on the greenback’s weakness. In contrast, commodity currencies like the Australian dollar crumbled under a double-whammy of external and domestic pressures. Below we break down the dramatic action in EUR/USD, GBP/USD, and AUD/USD – including the fundamental drivers, technical outlook, and key trading levels shaping each pair’s trajectory.
EUR/USD
Fundamental Outlook
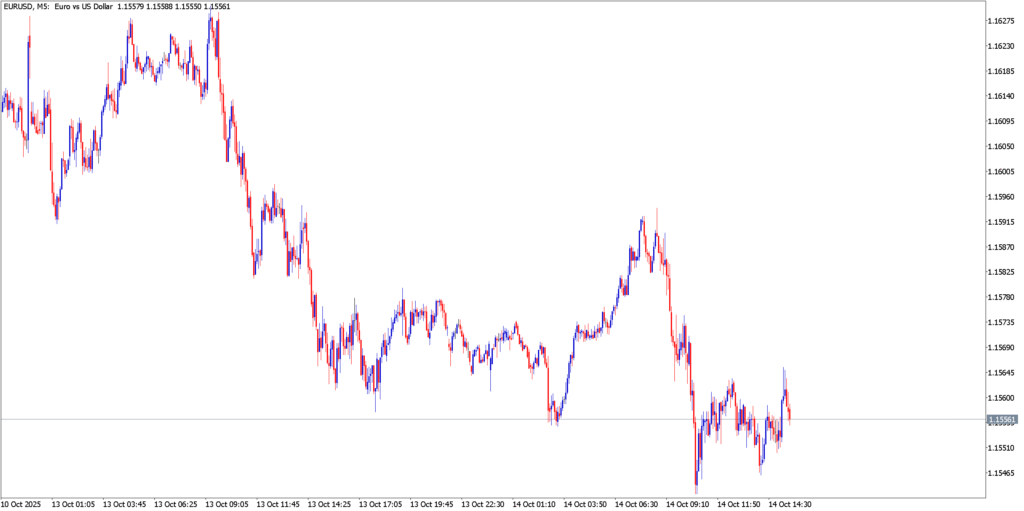
The euro climbed sharply, hitting a 10-day high above $1.17 in Friday’s Asian session. The broad dollar retreat gave EUR/USD a tailwind, as traders priced in nearly two more Fed rate cuts by year-end – a dovish shift that weakened the U.S. currency. At the same time, renewed trade war fears dented U.S. economic confidence, after President Trump declared the U.S. “in a trade war” with China and Beijing threatened export curbs on rare earths. This sent investors fleeing from the dollar into safer bets. The euro also drew support from European political relief: the newly appointed French government survived a no-confidence vote, easing regional stability concerns. With a data vacuum in the U.S. due to a government shutdown delaying reports, markets had little to offset the wave of dollar-negative sentiment. Overall, fundamental forces on the day skewed in the euro’s favor – Fed dovishness and U.S. turmoil versus a cautiously improving Eurozone outlook (September CPI of ~2.2% on deck, in line with expectations).
Technical Analysis
EUR/USD’s rally ran into an overhead wall of resistance in the mid-1.17s. Several analysts noted that upside momentum remains limited unless the pair can break firmly above ~$1.1680–1.1720. Indeed, during Thursday’s session the euro failed to sustain gains above the 50-day EMA and 1.16 acted as a magnet for prices, foreshadowing Friday’s struggle to extend beyond the early highs. Short-term momentum indicators flipped bullish as the euro spiked – on the 1-hour chart, the 20, 50, 100-period moving averages along with MACD, RSI, and Stochastics all flashed “Buy” signals during the upswing. However, this momentum showed signs of fizzling out late in the day; UOB strategists observed no significant increase in upward momentum and doubted any sustained rise beyond $1.17 for now. The RSI indicator, which had perked up with the rally, began to level off below overbought territory, and MACD histograms suggest fading upward force. If the euro slips back under $1.1600, it would confirm a false breakout – exposing downside targets at $1.1550, $1.1500, and even $1.1400 on a sharper reversal. Immediate support lies around the 1.1650 area (a level that had turned into a springboard for the latest jump) and deeper at $1.1600. On the topside, minor resistance from intraday highs near $1.1720 stands in the way of further gains, with a break above that region needed to revive the euro’s uptrend toward the next psychological handle at $1.1800.
GBP/USD
Fundamental Outlook
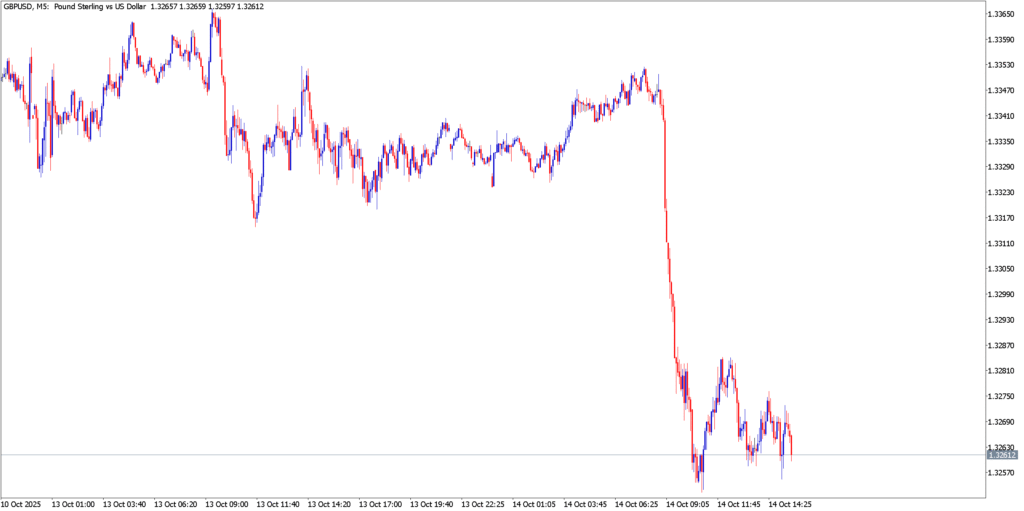
The British pound piggybacked on the dollar’s weakness, jumping to a one-week high around $1.3440 as the U.S. currency sagged. Fed rate-cut fever benefited GBP/USD by pulling down U.S. yields (the 10-year Treasury yield dipped near 4.00%), which undermined the dollar and allowed sterling to advance. However, the pound’s enthusiasm was checked by the UK’s own economic troubles. Fresh data confirmed the UK economy is barely growing – GDP in August rose just 0.1%, with July revised to a slight contraction. “Growth is still being hampered by high interest rates, higher taxes and soft overseas activity,” noted one economist, who doubts any improvement in Q4. Indeed, with inflation still uncomfortably high in Britain (and even ticking higher), the Bank of England has little room to maneuver. Policymakers are expected to hold rates steady for now, likely postponing any rate cuts until 2026 despite the flagging growth. This leaves the pound without a domestic boost. Market sentiment toward sterling remains cautious: while it enjoyed a relief rally thanks to the softer USD, analysts warn that the pound could quickly lose traction if global risk appetite deteriorates. Simply put, the UK currency does not have a strong fundamental floor – fragile growth, fiscal pressures, and no imminent BoE relief – so any surge driven by external factors could prove short-lived. Ongoing Brexit-related and political uncertainties (though less headline-grabbing at the moment) also linger in the backdrop.
Technical Analysis
Range-bound consolidation is the name of the game for GBP/USD. Despite this week’s pop, the pair remains locked in a broad range roughly between $1.3200 and $1.3600 that has prevailed through October. Friday’s price action around $1.34 sits near the midpoint of this range – essentially “fair value” in the current equilibrium. On the daily chart, sterling is hovering between its 50-day and 200-day EMA indicators, reflecting a lack of directional conviction. Notably, Thursday’s rally attempt stalled right at the 50-day EMA (~1.3420–1.3450), and the pound gave back some gains by Friday as the dollar firmed intraday. Momentum signals are mixed: recent upside movement has put GBP/USD above its short-term downtrend line, marking a bullish corrective wave on the short-term charts. The pair is also managing to hold above the EMA50 (50-day average), which is acting as a dynamic support on pullbacks. This suggests the near-term bias has turned mildly upward. However, other indicators flash caution. The RSI, which was approaching overbought territory during the rally, has now eased back to neutral levels after “offloading” those overbought conditions. Meanwhile, the MACD line remains flat to slightly negative on the daily timeframe, and stochastic oscillators are wavering, indicating momentum is not decisively bullish. In essence, sterling’s technical posture is one of choppy consolidation with a slight upward tilt. Key levels stand out: Resistance aligns at $1.3475 (a notable peak and the next hurdle for bulls), followed by the range top near $1.3600. On the downside, initial support comes at $1.3360 – a level identified as crucial for maintaining any bullish momentum. Below that, the floor of the range around $1.3200 becomes the bears’ target. As long as GBP/USD stays sandwiched in this zone, range-trading tactics will likely prevail.
AUD/USD
Fundamental Outlook
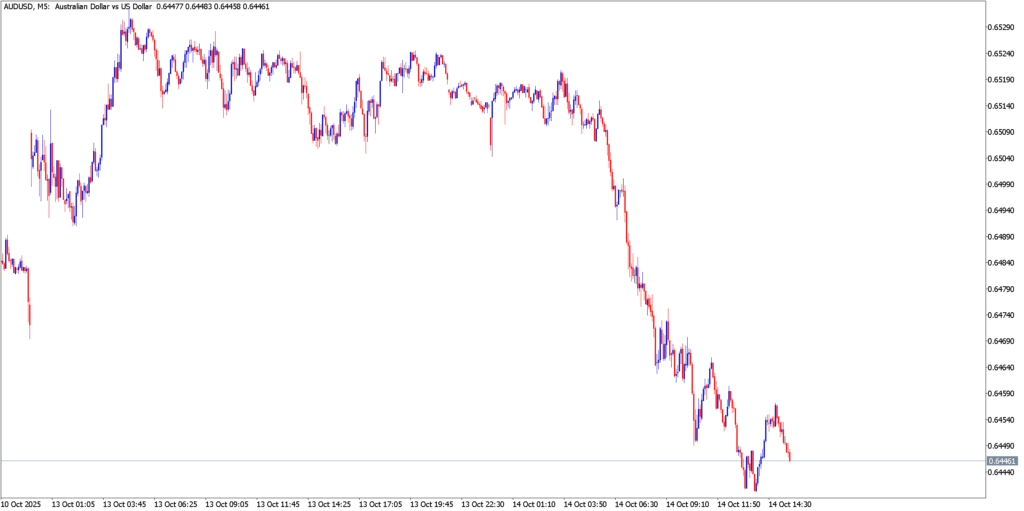
It was a rout for the Australian dollar, which plunged below the $0.6500 handle to its weakest levels in months. The AUD/USD pair extended its slide for a second straight session, caught in a perfect storm of bearish forces. Externally, Australia’s currency is highly sensitive to US–China trade relations, and the abrupt escalation in trade tensions has been devastating. With Washington and Beijing exchanging fresh tariff threats (including talk of tariffs up to 100% on certain goods), global investors fled riskier assets – leaving the trade-exposed Aussie cratering. Internally, Australia delivered worse-than-expected employment data that shocked the market. Unemployment spiked to a near four-year high, and job growth stalled, sparking aggressive bets that the RBA will cut interest rates at its next meetingi. Markets are now pricing in a 75%+ chance of an RBA rate cut in November, a sharp dovish turn that sent the Aussie spiraling lower. Essentially, the Aussie faced a double blow: deteriorating domestic fundamentals and souring global sentiment. Notably, Australia had no major data releases on Friday, but the hangover from the weak jobs report kept sentiment depressed. Safe-haven flows into gold (a commodity Australia exports) normally might aid the AUD, but in this case the risk-off mood overwhelmed any commodity linkage. Traders viewed the Aussie as a proxy for China risk and global growth, and with those narratives turning dark, selling was relentless. By day’s end, AUD/USD was deeply in the red, and the currency’s outlook appeared the most fragile of the major pairs.
Technical Analysis
The technical picture for AUD/USD is unequivocally bearish. The pair has been carving out lower lows and lower highs, remaining firmly entrenched in a downtrend channel since early October. All significant moving averages are angled downward, reflecting strong downside momentum. In fact, trading has stayed below the 50-period EMA on the charts, keeping negative pressure in place throughout recent sessions. Short-term technical signals are aligned with the bears: on Friday, every major indicator on the hourly chart was flashing “sell.” The 20, 50, 100 SMAs trended lower, and oscillators like MACD, RSI, and Stochastics were firmly in bearish territory. The RSI has dipped into the 30s, nearing oversold levels but not yet turning upward – a sign that selling momentum hasn’t exhausted itself. The MACD is deeply below zero with widening signal lines, illustrating strong downward momentum, and the Stochastic oscillator remains stuck in an oversold zone without a bullish crossover. This technical stance warned that any bounces in AUD/USD could be feeble. Support levels are being tested one after another. The pair initially sliced through the psychological $0.6500 floor, which now turns into immediate resistance on any recovery attempt. Just below, the mid-$0.6400s presented a temporary buffer – intraday price action flirted with support around $0.6460 (daily S1). A clear break under $0.6450 would likely accelerate losses. Chart patterns suggest little substantive support until the $0.6400 round figure, and beyond that lies the year-to-date low area in the upper-$0.6300s. Some analysts even eye the possibility of a steeper drop toward $0.6300 if panic selling continues, especially given the absence of obvious support levels once $0.6400 gives way. Resistance, on the other hand, is plentiful overhead: the initial cap is $0.6500 (the old support). Above that, the $0.6540–0.6560 zone (recent minor highs) and the 20-day SMA around $0.6600 are likely to repel any relief rally. Overall, the path of least resistance is clearly downward unless fundamental news sparks a dramatic reversal.
Market Outlook
This dramatic trading day underscores how sensitive markets are to the twin themes of monetary policy shifts and geopolitical strife. The rate jitters and risk-off waves that dominated today’s session could very well continue in the coming days. Traders worldwide will be nervously eyeing upcoming events: the Federal Reserve’s late-October meeting is on the horizon, and another rate cut (or any surprise stance) could turbo-charge moves in USD pairs. On the geopolitical front, the clock is ticking on the US–China trade truce – a key tariff deadline looms on November 10th, after which tariffs could snap back up to punishing levels if no extension is reached. Any headlines about high-level trade talks (or the lack thereof) will inject further uncertainty into currencies like AUD and overall risk sentiment. Meanwhile, economic data that is able to be released (despite the U.S. government shutdown) – such as global PMI figures, inflation readings, or UK budget announcements – can add fuel to the fire of volatility.