


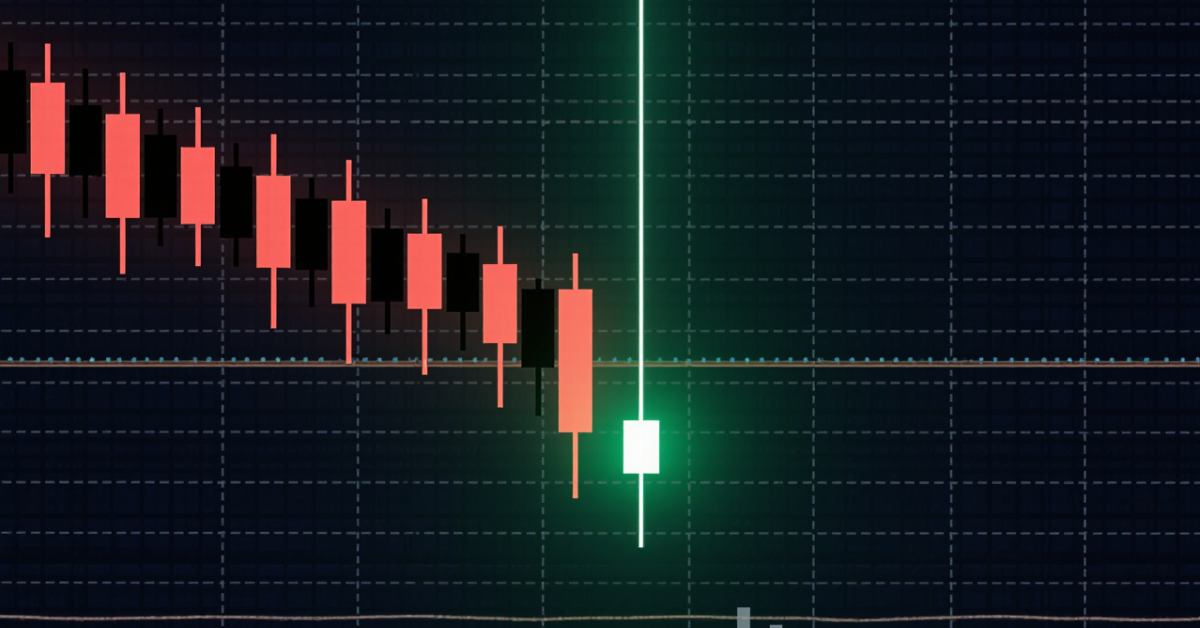
The inverted hammer candlestick, also known as the upside-down hammer pattern, is a bullish reversal candlestick that appears after a downtrend. It signals potential buying pressure as the price attempts to move higher, even though sellers push it back down before the candle closes.
Key Takeaways
- The inverted hammer candlestick appears after a downtrend.
- It is considered a bullish reversal candlestick signal.
- The upside-down hammer pattern has a long upper wick and small body.
- Confirmation is required before entering a trade.
- Candlestick chart signals work best with volume and support levels.
What Is an Inverted Hammer Candlestick?
The inverted hammer candlestick is a single-candle pattern found in technical analysis candlestick charts. It forms when the price opens, moves significantly higher during the session, then falls back near the opening price before closing.
Visually, it looks like this:
- A small body near the bottom of the candle
- A long upper shadow (wick)
- Little to no lower shadow
This upside-down hammer pattern often appears after a downtrend and may signal that buyers are starting to gain strength.
It is called “inverted” because it looks like a hammer turned upside down.
Why Is It a Bullish Reversal Candlestick?
The inverted hammer candlestick shows a battle between buyers and sellers.
During the session:
- Sellers initially dominate (downtrend continues).
- Buyers step in and push the price much higher.
- Sellers push the price back down near the open.
Even though price closes near the open, the long upper wick shows buyers were strong enough to drive price higher during the session.
This shift in momentum can signal a possible trend reversal.
However, confirmation is required before acting on this candlestick chart signal.
Structure of the Upside-Down Hammer Pattern
For proper identification, the upside-down hammer pattern should have:
- A small real body
- Upper wick at least twice the body size
- Very small or no lower wick
- Appearance after a clear downtrend
The position in the trend is critical. If it appears during an uptrend, it may not signal a bullish reversal candlestick.
Context matters in candlestick trading patterns.
Confirmation of the Inverted Hammer
A single inverted hammer candlestick alone isn’t enough to enter a trade. Confirmation is needed.
4 Common confirmation signals include:
- A strong bullish candle after the inverted hammer
- Increased volume on the next session
- Break above the inverted hammer’s high
- RSI moving upward from oversold levels
If the next candle closes above the inverted hammer’s high, it strengthens the bullish reversal candlestick signal.
Without confirmation, the pattern may fail.
Inverted Hammer vs. Shooting Star
Many traders confuse the inverted hammer and the shooting star because both candlestick patterns have a similar appearance. However, their meaning depends entirely on where they appear in a trend.
Both patterns typically have:
- A small real body
- A long upper shadow
- Little or no lower shadow
The key difference is trend context, which determines whether the signal is bullish or bearish.
| Pattern | Appears After | Signal Type |
| Inverted Hammer | Downtrend | Bullish reversal candlestick |
| Shooting Star | Uptrend | Bearish reversal candlestick |
Inverted Hammer (Bullish Signal)
An inverted hammer appears after a downtrend. It signals that buyers attempted to push the price higher during the session. Although sellers may have pulled the price back down before the close, the strong upward rejection suggests that bullish momentum could be building.
This pattern indicates a potential bullish reversal, especially when confirmed by the next candle closing higher.
Shooting Star (Bearish Signal)
A shooting star appears after an uptrend. It shows that buyers initially pushed prices higher, but sellers stepped in aggressively and forced the price back down before the close.
This rejection of higher prices signals a potential bearish reversal, particularly when followed by a strong bearish confirmation candle.
Why Location Matters
The structure of both candles is nearly identical. The difference lies in trend direction:
- In a downtrend, the pattern suggests buyers are stepping in → potential bullish reversal.
- In an uptrend, the same shape suggests sellers are taking control → potential bearish reversal.
In candlestick trading patterns, trend context determines meaning. Always analyze the overall market direction before acting on either signal.
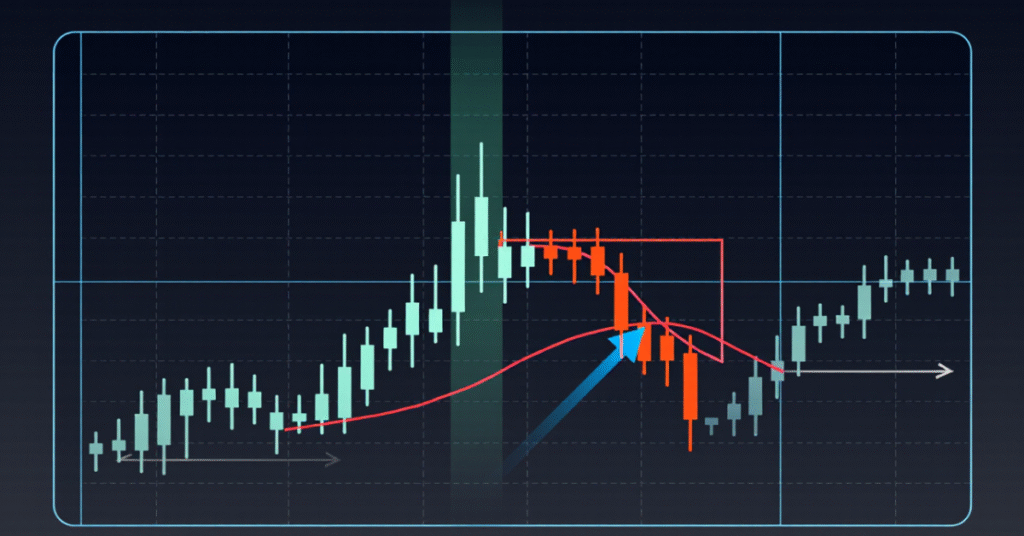
How to Trade the Inverted Hammer Candlestick
The inverted hammer candlestick is a potential bullish reversal pattern that appears after a downtrend. However, like all candlestick signals, it should not be traded blindly. Confirmation and risk management are essential.
Here is a simple and disciplined approach to trading the inverted hammer pattern:
Step 1: Identify a Clear Downtrend
The pattern must appear after a noticeable price decline. Without a prior downtrend, the inverted hammer loses its significance.
Step 2: Spot the Inverted Hammer
Look for:
- A small real body
- A long upper shadow
- Little or no lower shadow
This shows that buyers attempted to push prices higher during the session.
Step 3: Wait for Confirmation
Do not enter immediately. Wait for the next candle to close bullish (above the inverted hammer’s close). This confirms that buying pressure is continuing.
Step 4: Entry Point
Enter the trade slightly above the high of the inverted hammer or after the confirmation candle closes strongly bullish.
Step 5: Set Stop-Loss
Place your stop-loss below the low of the inverted hammer.
This creates a clearly defined risk level and protects you if the reversal fails.
Before trading live, build confidence by reviewing historical price charts and identifying inverted hammer patterns in different market conditions.
Start practicing candlestick chart signals today and sharpen your reversal trading skills.
Open a Live Trading AccountStart Trading Inverted Hammer Setups with Defcofx
Understanding candlestick chart signals like the inverted hammer is only useful if you can apply them in real market conditions. Traders use this bullish reversal candlestick to trade forex pairs, indices, commodities, and stocks, all of which react strongly to price action and volume.
Defcofx provides a trading environment designed for technical traders who rely on candlestick patterns and confirmation-based strategies.
Why Traders Choose Defcofx
- High Leverage Options: Trade with leverage up to 1:2000, giving flexibility when trading reversal setups
- 40% Welcome Bonus: Available on first deposits of $1000 or more, boosting initial trading capital
- No Commissions or Swap Fees: Tight spreads from 0.3 pips with no hidden trading costs
- Global Access: Traders from all countries supported with multi-language platforms
- Fast Withdrawals & Support: Withdrawals processed within 4 business hours, including weekends
Candlestick patterns work best with speed, precision, and execution, Defcofx is built for that.
Open a Live Trading AccountCombining the Inverted Hammer with Technical Indicators
The inverted hammer candlestick is most effective when it is confirmed by other technical indicators. Relying on a single candlestick pattern can lead to false signals, especially in volatile markets. Stronger trade setups occur when multiple forms of technical confirmation align.
Key Indicator Combinations to Look For
- RSI Below 30 (Oversold Conditions): When the Relative Strength Index (RSI) is below 30, it indicates that the market may be oversold. An inverted hammer forming in this zone suggests selling pressure could be weakening and a bullish reversal may follow.
- MACD Bullish Crossover: A bullish MACD crossover (MACD line crossing above the signal line) supports the idea that upward momentum is starting to build. When this occurs near an inverted hammer, it strengthens the reversal signal.
- Nearby Support Levels: Inverted hammer patterns are more reliable when they appear near a key support level, such as a previous swing low, demand zone, or moving average. Support increases the likelihood that buyers will defend the price area.
- Increase in Volume: Rising volume during or immediately after the inverted hammer shows stronger buyer participation. Volume confirmation adds credibility to the potential reversal.
Why Confluence Matters
When several indicators point in the same direction, the probability of a successful bullish reversal increases. This concept is known as confluence.
However, no setup is guaranteed. Never rely on one indicator alone. Always combine price action, indicators, and sound risk management before entering a trade.
Psychology Behind the Pattern
The inverted hammer candlestick reflects a shift in psychology. During a downtrend, sellers feel confident. When buyers suddenly push the price higher during the session, it creates uncertainty.
The long upper wick shows buyers tested higher prices. Even though sellers pushed back, buying interest was present. If buyers continue pushing the next day, the trend may reverse.
Candlestick trading patterns are visual representations of market emotion.
4 Common Mistakes When Trading the Upside-Down Hammer Pattern
The upside-down hammer (inverted hammer) is a useful bullish reversal candlestick, but many beginners misuse it by trading the pattern in isolation. This often leads to unnecessary losses.
4 Frequent Trading Mistakes to Avoid
- Trading Without Confirmation: One of the most common errors is entering a trade as soon as the inverted hammer forms. Without a bullish confirmation candle, the pattern may fail and the price can continue lower.
- Ignoring the Overall Market Trend: An inverted hammer only has meaning after a downtrend. Trading it in a sideways or uptrending market reduces its reliability.
- Entering Too Early: Premature entries often occur before the market shows clear buying pressure. Waiting for confirmation improves trade quality and reduces false signals.
- Not Using a Stop-Loss: Momentum can shift quickly. Failing to place a stop-loss exposes traders to large losses if the reversal does not occur.
Patience Is Essential
A bullish reversal candlestick doesn’t guarantee immediate upward movement. Price may consolidate or retest support before moving higher. Successful traders wait for confirmation and manage risk carefully.
Inverted Hammer in Different Timeframes
The inverted hammer candlestick can appear on:
- Daily charts
- Hourly charts
- Weekly charts
Higher timeframes generally provide stronger candlestick chart signals.
For beginners, daily charts are often easier to analyze because they reduce market noise.
Shorter timeframes may produce more false signals.
Example Scenario of an Inverted Hammer Setup
Imagine a stock falling for several days. It approaches a strong support level. An inverted hammer candlestick forms with a long upper wick.
The next day, the price opens higher and closes above the inverted hammer’s high with strong volume. This confirms the upside-down hammer pattern as a bullish reversal candlestick. A trader could enter above the high and place a stop-loss below the candle’s low. This structured method defines risk and potential reward clearly.
Final Thoughts on the Inverted Hammer Candlestick
The inverted hammer candlestick is a powerful bullish reversal candlestick when used correctly. This upside-down hammer pattern signals potential buying pressure after a downtrend, but confirmation is essential. In candlestick trading patterns, context, volume, and support levels increase accuracy.
By combining technical analysis candlestick methods with proper risk management, traders can use candlestick chart signals more effectively and reduce false entries.
Frequently Asked Questions
Is the inverted hammer candlestick always bullish?
No, the inverted hammer candlestick is not always bullish. It is considered a bullish reversal candlestick only when it appears after a downtrend and is confirmed by the next candle closing higher. Without confirmation, it may fail.
What is the difference between an inverted hammer and a shooting star?
The upside-down hammer pattern appears after a downtrend and signals a potential upward reversal. The shooting star appears after an uptrend and signals a potential downward reversal. Location determines meaning in candlestick trading patterns.
How reliable are candlestick chart signals?
Candlestick chart signals can be reliable when combined with trend analysis, support levels, and volume. Technical analysis candlestick patterns alone are not enough. Confirmation and risk management improve success rates.
Should beginners trade the inverted hammer pattern?
Yes, but cautiously. The inverted hammer candlestick is one of the simpler candlestick trading patterns to identify. Beginners should practice on historical charts first and always wait for confirmation before entering trades.
Can the inverted hammer appear on any timeframe?
Yes, the inverted hammer candlestick can appear on any timeframe. However, higher timeframes like daily or weekly charts generally provide stronger and more reliable candlestick chart signals.