


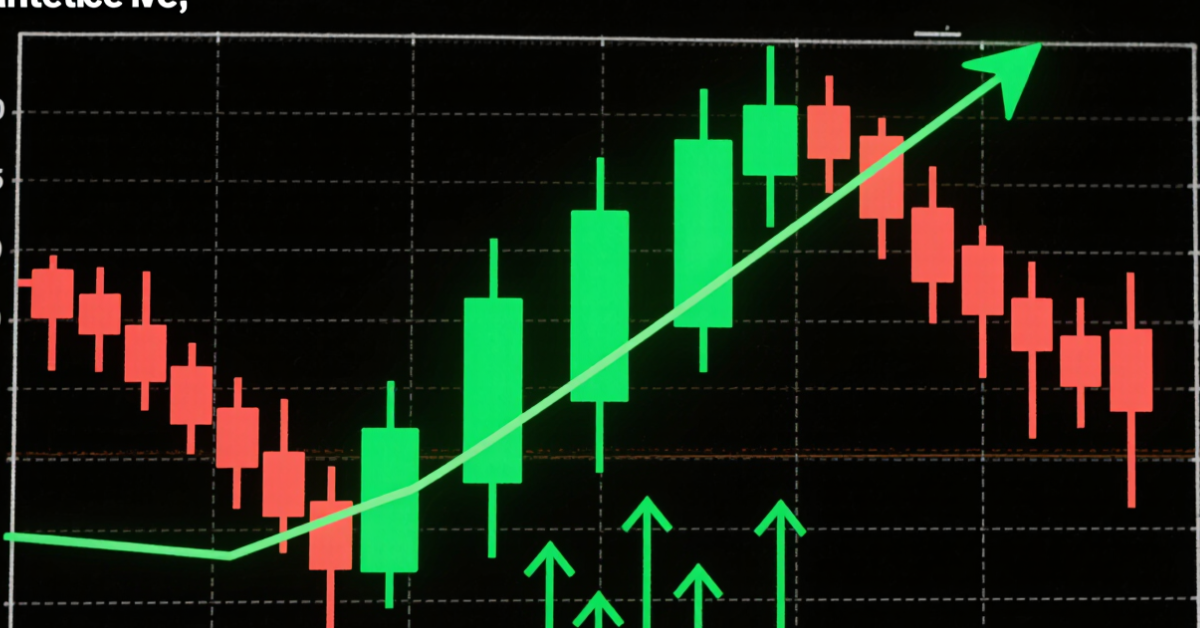
A bearish market becomes bullish in forex when prices stop making lower lows and start forming higher highs, signaling a shift in market structure. This change often follows a support bounce, a break of key resistance, or major news, indicating buyers are gaining control.
Key Takeaways
- A bearish-to-bullish shift means a trend reversal, not just a small pullback.
- Confirmation happens when price breaks a lower high and forms a higher low.
- Reversal signs often appear at strong support zones or Fibonacci levels.
- Economic news or interest rate changes can trigger market sentiment shifts.
- Traders use patterns, candlesticks, and indicators to confirm the new trend.
Understanding Bearish and Bullish Trends
In forex, a bearish trend is when prices consistently fall over time. The chart shows lower highs and lower lows. A bullish trend is the opposite, where price rises steadily, creating higher highs and higher lows.
To switch from bearish to bullish, the market must stop falling, stabilize, and start rising in a structured way. This isn’t about short bounces or fakeouts; it’s about seeing the market change direction for real.
Price Action Signals the Shift
The clearest sign that a bearish market is turning bullish is price action. If the pair stops falling and breaks above the most recent lower high, that’s a sign bears are losing control. Once it pulls back and forms a higher low, it confirms a bullish reversal.
This pattern, called a market structure shift, is used by many traders. It shows that buyers are now defending the price instead of letting it fall further.
Catalysts That Trigger a Bullish Reversal
A reversal usually needs a reason. Sometimes, it’s technical, so the price hits a strong support or Fibonacci zone. Other times, it’s fundamental, like positive economic news, a central bank raising interest rates, or sudden USD weakness.
Forex markets are driven by sentiment. A change in outlook (e.g., from risk-off to risk-on) can push traders to start buying the currency, leading to strong upward moves.
Bearish-to-Bullish Market Shift Comparison
| Signal Type | Bearish Market | Bullish Reversal Sign |
| Market Structure | Lower highs & lower lows | Break of previous high and higher low |
| Candlestick Signal | Long red candles | Bullish engulfing or pin bars at support |
| Volume | High on sell-offs | Rising on up candles after support holds |
| Sentiment Shift | Risk-off, panic | Renewed confidence, risk-on tone |
| Fundamentals | Weak GDP, poor NFP, low rates | Positive data, interest rate hikes |
Using Indicators for Confirmation
Indicators help confirm what price action is showing. Tools like the MACD crossover, RSI climbing above 50, or moving averages crossing upward all point to growing bullish momentum.
However, traders should wait for confluence, which is multiple signals lining up. One bullish candle isn’t enough. You want to see structure, volume, and confirmation before going long.
False Breakouts and Trap Zones
Not every move up means a reversal. Sometimes, a price spike above resistance triggers longs, then drops again. These are bull traps, which are fake moves designed to catch impatient buyers.
To avoid this, traders wait for confirmation. The best trades happen after price breaks structure, pulls back, and holds above previous resistance. This is the “change of character” many pros look for.
How Fundamentals Affect Trend Reversals
Let’s say NZDUSD is falling due to weak New Zealand data. Suddenly, the Reserve Bank of New Zealand surprises the market with a rate hike. That shocks traders, causing instant bullish pressure. Price breaks resistance, forms a new higher high, and a trend shift begins.
News acts as a trigger, but the technical chart tells the story of whether the reversal is sustainable.
Wait for the Break-Pullback-Continuation
The most reliable way to trade a shift from bearish to bullish is by using the break-pullback-continuation method. Wait for the structure break, let price retest the old resistance (now support), and enter when price shows strength on the pullback.
This helps avoid fakeouts and gives you a better entry with a smaller stop-loss.
Want to catch bullish reversals early? Join Defcofx and start trading the smart way today.
Open a Live Trading Account.FAQs
A bearish market is when a currency pair keeps making lower highs and lower lows. Sellers dominate, and prices fall steadily. Reversals can occur, but until the structure breaks, the trend is considered bearish.
The first clue is when the price breaks a previous lower high. This means buyers have pushed the price above the last level sellers controlled. If the price then holds a higher low, that confirms the bullish shift.
Yes. Events like interest rate hikes, inflation reports, or GDP surprises can quickly reverse market sentiment. But technical confirmation is still important before entering a trade.
Wait for three things: break of structure, retest of the broken level, and bullish confirmation (like a pin bar or engulfing candle). Avoid trading on the first breakout candle alone.
Yes, indicators like MACD, RSI, or moving average crossovers can help. But they should support what the price action is already telling you, not replace it.
Many reversals happen after stop hunts, when the price moves beyond support, grabs liquidity, and then reverses sharply. Smart traders spot these wicks and wait for bullish confirmation before entering.
Absolutely. Sometimes the reversal starts on lower timeframes (like 1H or 4H) before appearing on the daily chart. Checking multiple timeframes gives you better confirmation and confidence.
Defcofx Forex Articles You Shouldn’t Miss
Discover powerful forex strategies in these top reads from Defcofx.