


Trend-based Fibonacci numbers in forex refer to ratios like 38.2%, 50%, and 61.8% that help identify potential price reversals or continuations during trending markets. Traders use these levels to find support, resistance, and target zones when entering or exiting trades.
Key Takeaways
- Fibonacci levels mark retracement and extension zones during trends.
- Common ratios include 38.2%, 50%, 61.8%, and 161.8%.
- Helps spot support/resistance in trending markets.
- Works best with clear directional momentum.
- Not standalone, combined with price action or trend tools.
- Used across all forex pairs, especially majors like EUR/USD and GBP/USD.
What Are Fibonacci Numbers in Forex?
Fibonacci numbers come from a mathematical sequence where each number is the sum of the two before it. While this sequence itself isn’t unique to trading, the ratios are derived from it.
In forex, these ratios are used to calculate potential retracement or extension levels in price movements. The logic is psychological, traders tend to act at predictable percentage pullbacks or extensions during a trend. This gives Fibonacci tools their power when analyzing market behavior.
Fibonacci trading tools are included in most charting platforms. But instead of using the full sequence, forex traders mainly use rounded ratios: 23.6%, 38.2%, 50%, 61.8%, 78.6%, and 161.8%.

Understanding Trend-Based Fibonacci Retracements
Retracements happen when the price temporarily moves against the dominant trend before continuing. Traders use Fibonacci retracement levels to anticipate where that pullback might end.
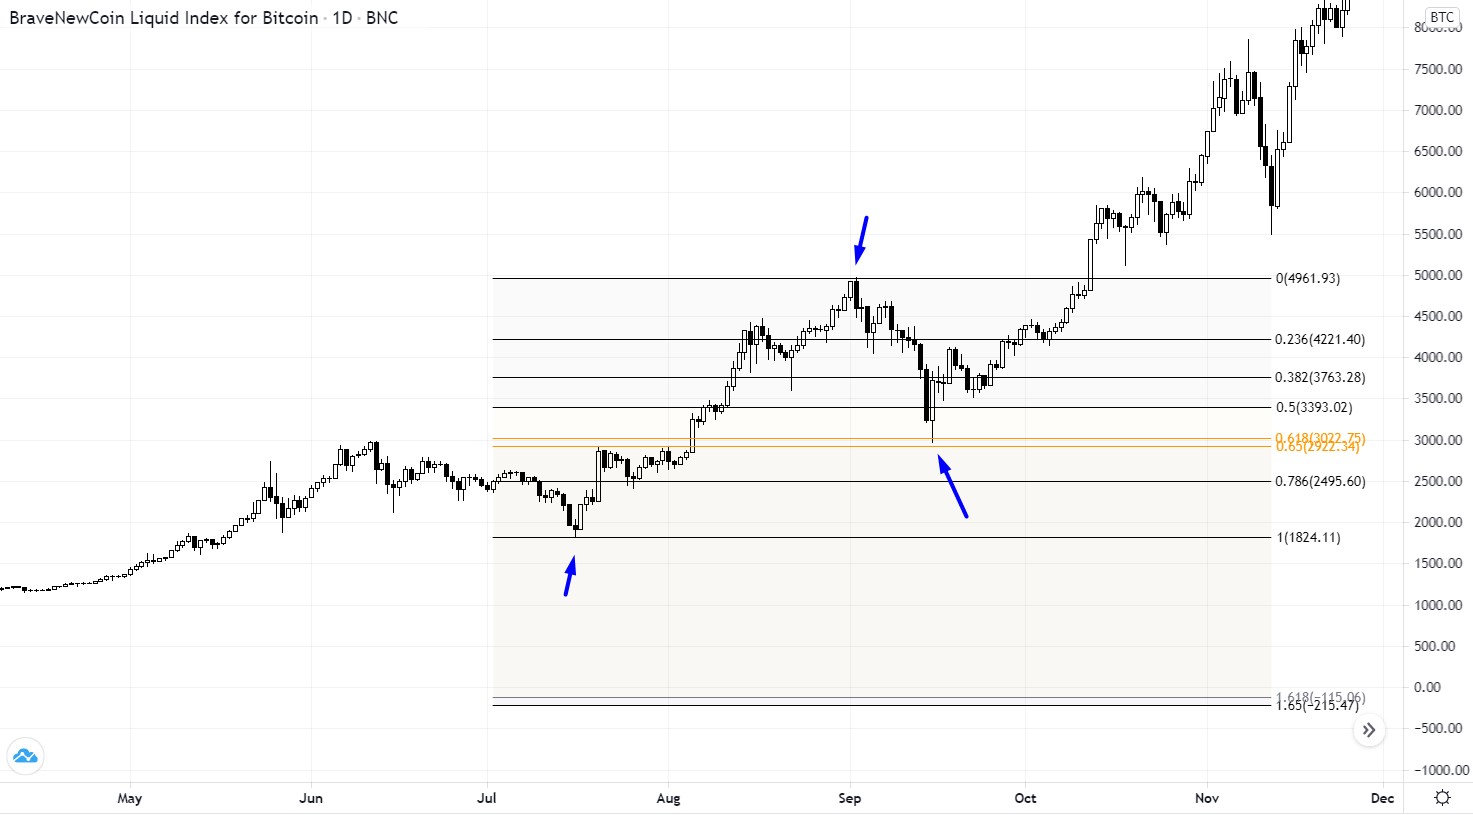
The most commonly used retracement levels are 38.2%, 50%, and 61.8%. These are calculated by identifying a recent swing high and swing low, then projecting the retracement levels in between.
For example, in an uptrend, a trader draws the Fibonacci retracement from the low to the high. The resulting levels show where price may find support if it starts pulling back.
These levels are popular because they align with real behavior. Traders often set buy or sell orders at or near these areas. When combined with confirmation tools like candlestick signals or RSI divergence, retracements offer high-probability entry zones.
Spotting Trend Targets with Fibonacci Extensions
Fibonacci isn’t just for pullbacks. It’s also used to find target levels when the trend continues.
This is where Fibonacci extensions come into play. After a retracement completes, traders look to extension levels such as 127.2% or 161.8% to project how far the price might move.
For example, let’s say EUR/USD is in an uptrend, pulls back to the 50% level, then bounces. Traders use extensions to measure from the swing low to swing high, then from the retracement low. The 161.8% level becomes a projected resistance or take-profit area.
Applying Fibonacci in Forex Charts
To apply Fibonacci tools properly:
- Identify a strong trend (either up or down).
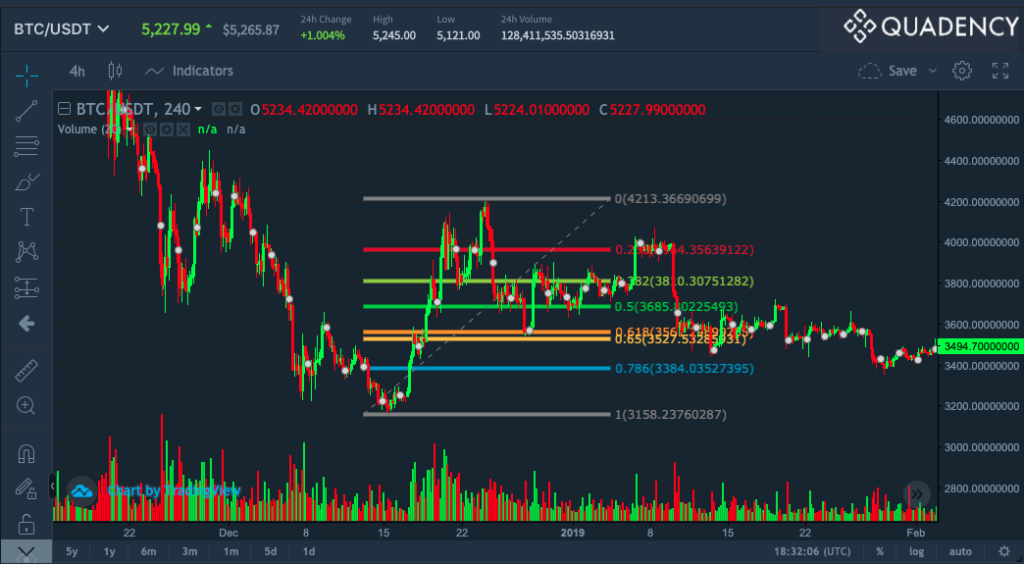
- Select the swing high and swing low points.
- Apply the retracement tool in the correct direction (low to high for uptrend, high to low for downtrend).
- Watch how price reacts to 38.2%, 50%, and 61.8% levels.
- If a bounce happens, use extension tools to plan take-profit levels.
Some traders also draw Fibonacci levels on multiple timeframes (e.g., 1H and 4H) to identify overlapping zones; these are called confluence areas and are often very powerful.
Advantages and Limitations of Fibonacci Tools
| Advantages | Limitations |
| Based on natural mathematical patterns and crowd behavior. | It doesn’t predict direction, just potential reaction zones. |
| Easily available on all major trading platforms. | Can generate false signals in sideways or choppy markets. |
| Effective in trending markets with strong momentum. | Requires confluence with other tools to improve reliability. |
| Provides a framework for both entries and exits. |
5 Tips for Traders Using Fibonacci
- Use Fibonacci only in trending conditions.
- Combine with support/resistance levels or moving averages.
- Don’t rely solely on one Fibonacci level; watch for cluster zones.
- Use confluence with volume, candles, or price structure.
- Backtest your Fibonacci setups before going live.
By using these strategies, traders can turn Fibonacci tools into high-precision entry and exit systems, especially when paired with sound risk management.
Final Thoughts on Trend-Based Fibonacci in Forex
Trend-based Fibonacci tools remain one of the most reliable methods for analyzing retracements and extensions in forex markets. They don’t predict direction, but they highlight key areas where price is likely to react, giving traders structure and discipline in both entries and exits. When combined with confluence tools, proper risk management, and a clear trading plan, Fibonacci strategies can significantly improve decision-making and consistency.
If you’re ready to put Fibonacci strategies into practice, Defcofx provides the perfect trading environment with:
- High Leverage Options: Trade flexibly with leverage up to 1:2000.
- 40% Welcome Bonus: Available on first deposits of $1000 or more.
- No Commissions or Swap Fees: Low spreads starting from 0.3 pips.
- Global Access: Serving traders worldwide with multilingual support.
- Fast Support & Withdrawals: Completed within 4 business hours, including weekends.
FAQs
In forex, Fibonacci numbers refer to price levels based on mathematical ratios like 38.2%, 50%, and 61.8%. These help traders spot areas where price may reverse or continue during a trend.
Fibonacci levels are widely used and respected in trading, but they’re not guaranteed. They work best when combined with other tools and used in clear trending conditions.
Retracement levels show where price may temporarily reverse before resuming trend. Extension levels project where the price might go beyond the previous swing high or low.
Yes. Fibonacci retracement and extension tools work on all timeframes—from 1-minute charts to weekly charts. However, higher timeframes often provide stronger signals.
The most commonly used Fibonacci ratios in forex are 38.2%, 50%, 61.8% for retracements and 127.2%, 161.8% for extensions. These tend to align with price reactions.
Fibonacci analysis can be applied to any forex pair, though it’s most effective on major pairs with high liquidity like EUR/USD, GBP/USD, and USD/JPY.
The 161.8% level is a key Fibonacci extension. In strong trends, this level often acts as a natural take-profit zone or future resistance/support, depending on the trend direction.
Defcofx Forex Articles You Shouldn’t Miss
Discover powerful forex strategies in these top reads from Defcofx.