


An MT4 entry indicator is a tool used on MetaTrader 4 that automatically signals optimal buy or sell points by analyzing price, trend, or momentum data in real time. It helps traders spot potential entry opportunities without manually reading complex charts, improving timing and consistency.
Key Takeaways
- An MT4 entry indicator helps traders identify optimal buy or sell points by analyzing price, trend, or momentum data, improving trade timing and consistency.
- Using reliable entry indicators (trend, breakout, support/resistance, and momentum) on the MetaTrader 4 (MT4) charts simplifies decision-making compared with manual chart reading.
- No indicator is perfect; many are lagging or may give false signals; combining multiple indicators (e.g., trend + momentum) improves reliability.
- Entry indicators perform best when used within a disciplined strategy: proper timeframe, confirmation, risk management, and not as “magic signals.”
What Is an MT4 Entry Indicator?
An “entry indicator” on MetaTrader 4 (MT4) is a type of technical indicator, a mathematical tool applied to price and/or volume data that helps traders forecast potential future price movements.
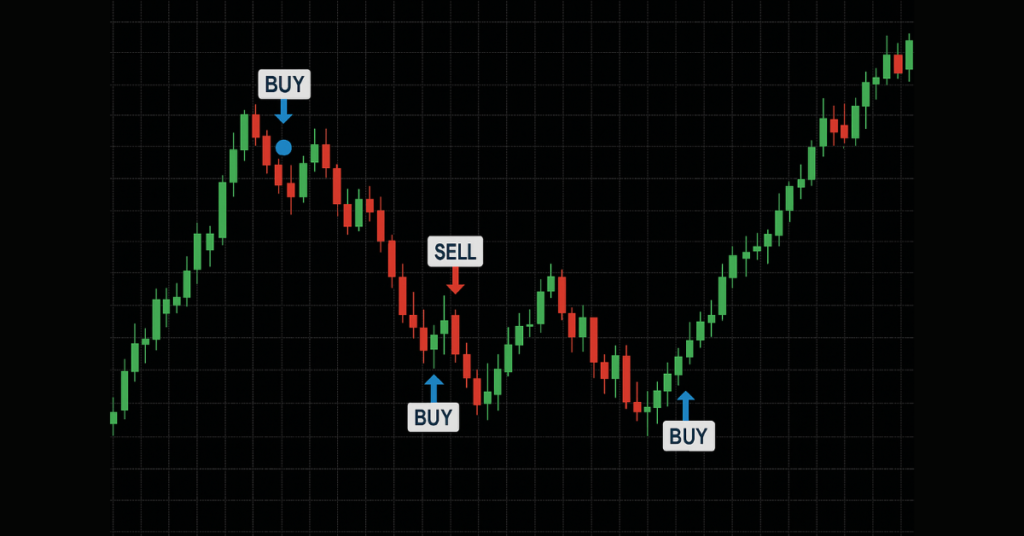
On MT4, entry indicators are used to identify favorable moments to open a buy or sell order. They analyze historical and real-time data (such as price action, trend, momentum, and volatility) and present signals or visual cues (e.g., arrows, color changes, and trend lines) to suggest when market conditions meet a trader’s predefined criteria for entering a trade.
These indicators can be built-in (standard) or custom-made/downloaded. MT4 supports a large variety of both built-in and custom indicators, from simple ones like moving averages to complex custom “entry signal” indicators.
Whether you are trading forex, commodities, or other markets supported on MT4, an entry indicator helps to reduce guesswork by showing chart-based signals that reflect current market data and potential patterns, making it easier for both beginners and experienced traders to identify entry opportunities.
How MT4 Entry Indicators Generate Buy/Sell Signals
On MetaTrader 4 (MT4), entry indicators generate buy or sell signals by mathematically analyzing market data such as price history, momentum, volatility, or trend direction and then marking charts with visual cues (e.g., arrows, color changes) when conditions match predefined entry criteria.
For example, a basic yet widely used method uses a “crossover” of two averages: when a shorter-period moving average crosses above a longer-period average, the indicator interprets this as a shift to bullish momentum triggering a buy signal. Conversely, a downward cross signals a potential bearish turn, prompting a sell signal.
Other indicators track momentum or market conditions instead of just trends. For instance, when momentum indicators show that an asset is oversold and beginning to reverse upward, that can trigger a buy signal, while overbought readings may trigger sell signals.
Some entry indicators combine multiple analyses (trend, momentum, volatility, support/resistance) to produce more reliable signals; this multi-factor approach reduces the likelihood of false signals from random price noise.
Types of MT4 Entry Indicators
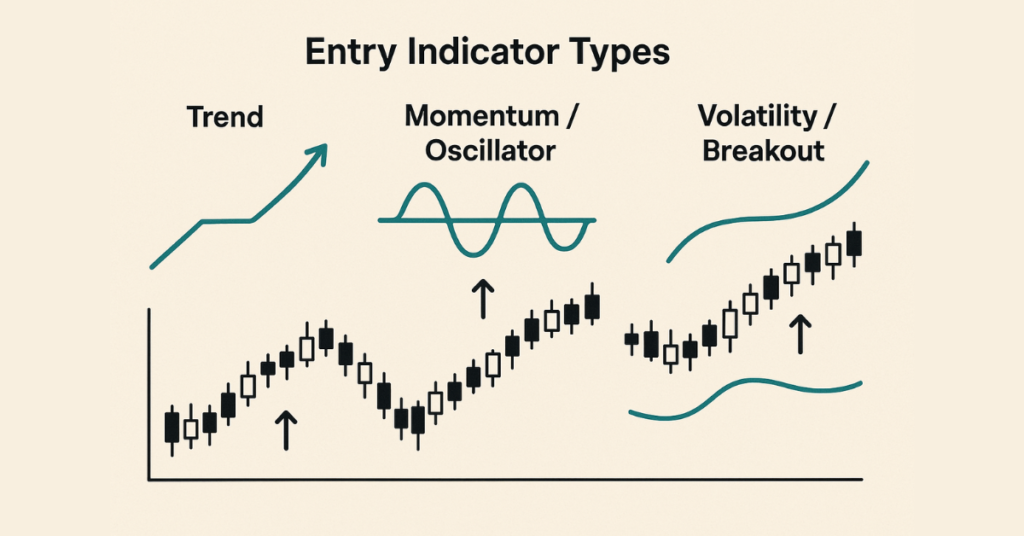
On MetaTrader 4 (MT4), there are several types of entry indicators, each built for different market conditions, trading styles, and entry strategies. Choosing the right type depends on whether you trade trends, breakouts, reversals, volatility, or range‑bound markets.
Here are the main types:
Trend‑Following Indicators
Trend-following indicators help you identify the market’s prevailing direction (uptrend or downtrend) and enter trades in line with that trend. Common tools include:
- Moving Average (MA) simple (SMA), exponential (EMA), or other variants. They smooth out price data to show the average price over a timeframe. When price stays above MA, it can indicate an uptrend; below MA suggests a downtrend.
- Trend‑strength and confirmation indicators like ADX (Average Directional Index), which helps assess how strong a trend is and whether the trend‑based signals are reliable.
- Channel- or band-based trend tools such as Bollinger Bands or channel indicators that plot upper and lower boundaries around price action are useful for trend identification and potential entries along the trend.
Trend indicators are best when markets are trending. They help avoid trading against the dominant direction, reducing the risk of “fighting the market.”
Oscillators / Momentum & Reversal Indicators
Oscillators measure momentum, overbought/oversold conditions, or potential reversals. These work well in range‑bound or consolidation phases.
Notable examples:
- The Relative Strength Index (RSI) identifies overbought (often above 70) or oversold (often below 30) conditions; when the price is oversold, it may signal a potential upward reversal, and vice versa.
- The stochastic oscillator compares the closing price relative to the price range over a period; it is typically used to spot potential reversal points in range markets.
- Other oscillators or momentum‑based tools, such as the Commodity Channel Index (CCI) and rate-of-change/momentum indicators, are useful for identifying cyclical trends, reversal points, or entry timing when momentum shifts.
Oscillators are especially helpful when the market lacks a clear trend or when you want to catch a reversal or bounce from support/resistance zones.
Volatility & Range / Breakout Indicators
Some indicators focus on volatility, breakout potential, and support/resistance, useful for breakout‑based strategies or trading in volatile markets.
Examples:
- Bollinger Bands, besides trend use, help detect volatility expansions or contractions; a tightening of bands might indicate a potential breakout, whereas a price touching upper or lower bands could signal extremes and reversals.
- Volatility-based tools like Average True Range (ATR): ATR doesn’t give direction but measures the degree of price movement. Traders use ATR to gauge how large a move might be to set stop-loss/order sizes based on expected volatility.
- Support/resistance and channel indicators that mark potential breakout zones, when the price breaks above or below these zones, it may trigger a strong move (breakout entry) rather than a simple reversal.
These types suit traders looking for aggressive entries, catching new trends or breakouts early rather than conservative trend‑following or reversal strategies.
Comparative Table: MT4 Entry Indicator Types & When They Work
| Indicator Type | Best Market Conditions | Common Case / Entry Signal |
| Trend‑Following (MA, ADX, Channels) | Strong trending markets | Enter trades in direction of trend, after confirmation (e.g. MA crossover, ADX > threshold) |
| Oscillators/Momentum (RSI, Stochastic, CCI) | Range-bound or consolidating markets; potential reversals | Enter on oversold (buy) or overbought (sell) conditions, divergence, bounce from extreme zones |
| Volatility/Breakout (Bollinger Bands, ATR, Price Channels) | Low-volatility or squeeze zones → breakout; volatile markets | Enter when price breaks out of support/resistance or bands, or when volatility spikes |
Why It Matters: Matching Indicator Type to Strategy & Market Conditions
Using the right type of entry indicator for the prevailing market condition greatly increases your probability of success. For instance:
- In a trending market, a trend‑following indicator reduces the risk of false reversals.
- In a sideways or range market, oscillators help you catch reversals or bounces.
- In volatile or breakout‑prone markets, volatility/breakout indicators enable timely entries on momentum shifts or breakouts.
Mixing indicator types (trend + momentum + volatility) for confirmation can also reduce false signals, but overloading charts with too many indicators can cause confusion rather than clarity.
Best Entry Indicator for MT4 (With Examples)
There is no one “magic” entry indicator for MetaTrader 4 (MT4) that works perfectly in all markets, but some indicators consistently stand out as among the best for generating entry signals, depending on market conditions and your trading style. Below are some of the most reliable and widely used MT4 entry indicators and how/when they work best.
Top Recommended Indicators for Entry
- The Relative Strength Index (RSI) is a momentum oscillator that measures overbought/oversold conditions. When RSI drops below 30 and then starts to rise, it may signal a buy opportunity; when above 70 and falling, a potential sell opportunity.
- MACD (Moving Average Convergence Divergence) is a trend and momentum indicator that uses two exponential moving averages and a signal line; crossovers or divergence between the MACD line and the signal line often indicate possible trend changes or entry points.
- Bollinger Bands are a volatility-based indicator that tracks price’s standard deviation around a moving average; when price touches upper or lower bands (or during a “band squeeze”), it may signal potential reversal or breakout entry opportunities.
- Moving Average Crossover (MA Crossover) uses a shorter-period and longer-period moving average to identify trend direction; when the short‑term MA crosses over the long‑term MA, it may signal the start of a new trend and act as an entry trigger.
When Each Indicator Works Best: Examples
| Indicator | Best Market Condition/Use Case |
| RSI | Range-bound or consolidation markets, when you expect reversals (overbought/oversold) |
| MACD | Trending markets or when momentum shifts good for catching trend‑based moves or reversals |
| Bollinger Bands | When volatility is low or squeezed → potential breakout or the chance to catch reversals near extremes |
| MA Crossover | When trend direction is becoming clearer for traders wanting to “ride the trend” rather than catch reversals |
Why These Are Among the “Best” for Many Traders
- They are available by default (built-in) on MT4 with no need for paid custom indicators.
- They suit a variety of trading styles: from scalping to swing trading, from trend-following to range‑trading.
- They are relatively simple to understand and interpret, which helps new and experienced traders avoid confusion or “indicator overload.”
How to Use an MT4 Entry Indicator (Step-by-Step)
Using an entry indicator on MetaTrader 4 (MT4) is a straightforward process. Below is a clear, practical guide:
MT4 Entry Indicator Download References
1. Entry Signal++ Indicator (Free)
A visual entry indicator for MT4 that plots BUY and SELL arrows and shows market direction via colored bars — useful for spotting entry points.
👉 Download: Entry Signal++ Indicator for MT4 — https://indicatorspot.com/indicator/entry-signal-indicator/ indicatorspot.com
👉 Alternative free version: Forex Entry Signal++ Indicator MT4 — https://www.forexracer.com/forex-entry-signal-indicator-mt4/ ForexRacer
2. Entry Signal MT4 Indicator (Free)
Shows bullish, bearish, and neutral trend conditions with corresponding arrow signals — great for entry timing and trend confirmation.
👉 Download: Entry Signal MT4 Indicator — https://www.mt4collection.com/collection/entry-signal/ MT4 Collection
3. Forex Entry Point Indicator MT4 (Free)
Provides colored entry/exit signals based on trend direction — helps identify when to open or close trades.
👉 Download: Forex Entry Point Indicator for MT4 — https://www.forexracer.com/forex-entry-point-indicator-mt4/ ForexRacer
4. UltradeFX Master Entry Indicator (Free)
A powerful entry guide giving real-time buy/sell signals with a dashboard for trend strength and signal clarity.
👉 Download: UltradeFX Master Entry Indicator — https://indicatorspot.com/indicator/ultradefx-master-entry-indicator/ indicatorspot.com
5. Entry Points Pro Indicator for MT4 (Free)
Shows entry signals in trending and sideways markets, often with visual arrows and basic statistics of past signals.
👉 Download: Entry Points Pro Indicator for MT4 — https://indicatorspot.com/indicator/entry-points-pro-indicator/ indicatorspot.com
Place the indicator file in the proper MT4 folder
Open MT4 → go to File → Open Data Folder.
Then navigate to MQL4 → Indicators and paste the downloaded .mq4 or .ex4 file there.
If the indicator comes with a .dll file (some advanced entry indicators do), move that file to MQL4 → Libraries as well.
Refresh or restart MT4 to load the indicator
Close and reopen MT4, or open the Navigator panel (Ctrl + N), right-click on Indicators, and select Refresh.
This makes the new entry indicator appear in the list.
Attach the indicator to your chart
In the Navigator panel under Custom Indicators, find your entry indicator and drag & drop it onto the chart you want.
Alternatively:
Right-click the chart → Indicators List → choose the indicator → click OK.
Adjust indicator settings (optional but recommended)
After attaching the indicator, a settings window appears. You can adjust parameters such as:
- Calculation periods
- Signal sensitivity
- Colors and visual style
If you use multiple indicators or a specific setup, save the configuration as a template to avoid re-configuring each time.
Test the indicator on a demo account first
Always test new entry indicators in a demo environment before risking real money. This helps you understand how signals behave under different market conditions.
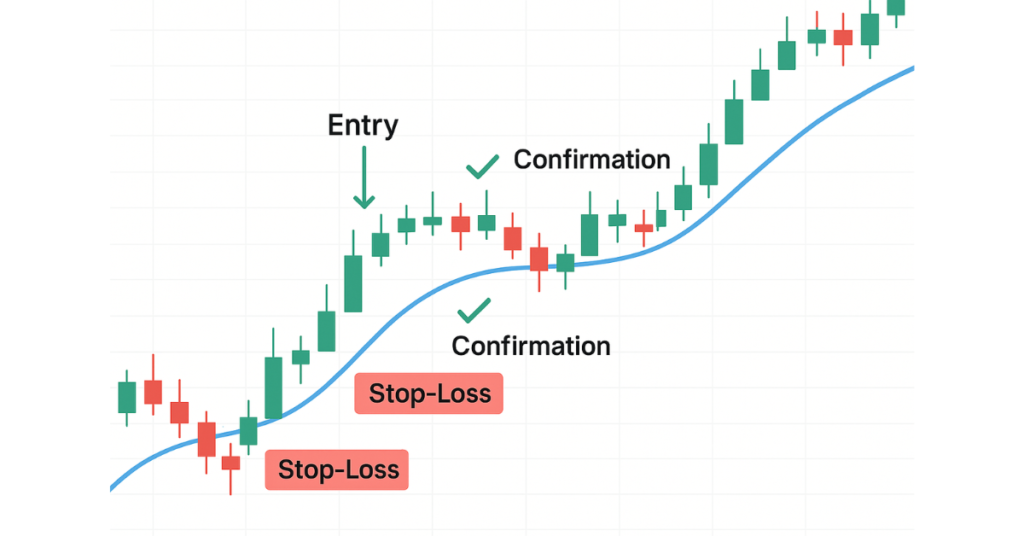
Use entry signals with proper strategy & confirmation
Do not rely on a single entry signal alone. Combine entry indicators with:
- Trend direction
- Support and resistance levels
- Volatility or momentum confirmation
This helps reduce false signals and improves trade quality.
Remember: an entry indicator is a tool, not a guarantee. Market conditions can change quickly, so discipline and risk management remain essential.
- Avoid indicators from unverified or suspicious sources, especially those using .dll files.
- Do not use any indicator on a live account without sufficient demo testing.
- Avoid overcrowding your chart, too many indicators create conflicting signals.
- Never follow signals blindly; always confirm with market context (trend, volatility, support/resistance).
MT4 Buy/Sell Entry Indicators (Automated Tools)
On MetaTrader 4 (MT4), “buy/sell entry indicators” often come as custom or automated tools (sometimes paired with Expert Advisors EAs) that generate signals for entry points automatically, showing arrows or alerts on the chart when certain conditions are met.
What’s Good About Automated Indicators & Signals
Using automated buy/sell indicators on MT4 offers several advantages:
- Indicators can simplify trading decisions by removing emotional bias and guesswork. The tool monitors price, trend, momentum, or volatility and triggers a signal when conditions match predefined rules.
- They save time, and you don’t need constant manual chart analysis. For busy traders or those new to trading, automation allows reacting faster when opportunities emerge.
- They provide flexibility across timeframes and markets; many indicators work on multiple symbols and timeframes, making them usable for swing trading, scalping, or day trading depending on your style.
Because MT4 supports both builtin and custom indicators, this flexibility appeals to a wide range of traders, from beginners to experienced, making automated entry indicators a popular tool.
Risks & Limitations of Relying on Automated Signals
No matter how advanced, automated indicators aren’t perfect. They can produce false signals, especially in choppy or ranging markets where price movement is unpredictable.
- Many are lagging indicators because they rely on historical price data; signals might come after a significant price move has already occurred, reducing profit potential.
- There’s a danger of over-reliance: traders might follow signals blindly without applying trend analysis, support/resistance, or risk management, which increases exposure to unexpected losses.
- Automated signals (or EAs) may also struggle to adapt quickly to sudden market changes (news events, spikes in volatility), since they follow predefined rules and might not “know” to adjust.
Best Practices for Using Automated Entry Indicators on MT4
To make the most of buy/sell indicators while minimizing risks:
- Always confirm signals with additional analysis (trend lines, support/resistance, volatility context) rather than blindly following every arrow.
- Use stop-loss and take-profit orders Automation doesn’t eliminate risk, so guard each trade appropriately.
- Backtest and demo-test the indicator or EA before using real funds; historical market data and live demo use help verify reliability.
- Avoid overloading charts with multiple overlapping indicators; too many signals can conflict, causing confusion.
- Understand that automated tools are a component of your strategy, not a replacement for disciplined trading, risk management, and market understanding.
Entry Strategies Using MT4 Indicators
When using MetaTrader 4 (MT4), combining entry indicators with sound strategy frameworks helps turn “signals” into viable trades. Here are several popular, effective strategies that many traders use with guidance on which indicator types to combine and when to enter.
Trend‑Following Strategy (with Pullbacks or Continuations)
This strategy works well when a strong trend is already in place.
First confirm the trend, then wait for a pullback (a temporary price retracement) to enter.
This way you aim to “go with the trend,” reducing the chance of being caught fighting market direction.
Breakout Entry Strategy
In markets that are consolidating or ranging, where price moves sideways and volatility is low, breakouts often precede strong moves. In such cases, breakout‑based entries can work well. Use volatility or breakout indicators (e.g., channel/band indicators) combined with trend filters to catch breakout entries on MT4.
Pullback + Support/Resistance Strategy
This strategy mixes price‑action concepts with indicator validations. Traders wait for a pullback price retracing from recent swings to a meaningful support or resistance level, then look for confirmation (e.g., bullish/bearish reversal candle pattern, oscillator/momentum confirmation) before entering.
Often, an oscillator (e.g., RSI) or volatility indicator is used to check whether pullback depth is reasonable and volatility is sufficient, minimizing the chance of entering a weak or false retracement.
Combined Confirmation Strategy (Multi‑Indicator + Multi‑Timeframe)
Because no single indicator is perfect, many successful MT4 traders combine multiple types of trend, momentum, volatility, and support/resistance tools to increase the reliability of entries. For example, they may use moving averages to define trend, RSI or MACD for momentum/oscillator confirmation, and volatility bands or ATR to gauge market activity.
Also, they sometimes check across different timeframes using a higher timeframe (e.g., H4, D1) to confirm the market direction and a lower timeframe (e.g., H1, H4, or H1/H4 depending on style) for precise entry, which helps filter noise and avoid false signals.
How to Choose the Right Strategy
- If the market shows a strong directional move (clear highs and lows), a trend‑following or pullback strategy is often safer.
- If the market is consolidating or trading sideways, a breakout or strategy may yield better results.
- For a more conservative or swing‑trading style, use combined confirmation with multiple indicators and time‑frame filters to reduce risk.
- Always adapt based on volatility, time frame, and market behavior; avoid forcing a strategy if market conditions don’t match.
Final Thoughts on the MT4 Entry Indicator
MT4 entry indicators can be powerful tools for traders when used wisely. They help simplify market analysis by turning price, trend, momentum, or volatility data into clear buy/sell signals. However, they are by no means foolproof; many are lagging or can give false signals, especially in choppy or unpredictable markets.
Success with entry indicators comes from combining them with solid trading discipline: confirm signals with multiple indicators or price‑action analysis, use proper risk management, and avoid overloading charts with too many tools.
If your broker conditions are favorable (low spreads, good execution speed, reliable data feed entry), indicators tend to perform better, because signal accuracy depends not just on the indicator logic but also on clean data and the execution environment.
In short: treat MT4 indicators as helpful tools, not magic. Use them as part of a bigger trading strategy, always test (demo/backtest) before trading real money, and remain patient, disciplined, and aware of market context.
FAQs
There is no “one‑size‑fits‑all” most accurate but many experienced traders rely on combinations of tools such as Relative Strength Index (RSI), Moving Average (MA), Bollinger Bands, or MACD, adjusting settings based on market conditions and using them together for confirmation.
No, relying solely on indicators is risky. Indicators often lag price and can generate false signals, especially in volatile or sideways markets. They should complement, not replace, other analyses like price action, market context, and risk management.
It’s generally best to keep it simple. Most effective setups use 2–3 complementary indicators (e.g., one trend-based, one momentum-based, and maybe a volatility or support/resistance tool). Overloading charts with too many tools can cause conflicting signals and “analysis paralysis.”
Absolutely, backtesting on historical data and practicing on a demo account helps you understand how a given indicator (or combination) performs under different market conditions. It reduces the risk of costly mistakes when you trade live.
Yes. Indicators analyze past or current price data; they cannot predict sudden market moves due to news or fundamental events. Also, a broker’s data feed, execution speed, and spread conditions influence real‑time performance; poor conditions may distort signals or execution.