


Reading Heikin Ashi candles involves analyzing smoothed candlestick patterns that help reveal clearer market trends. Unlike traditional candlesticks, Heikin Ashi uses averaged price data to reduce market noise, making it easier for you to identify trends, momentum shifts, and potential reversal points in forex trading.
Key Takeaways
- Heikin Ashi candles smooth price movement to make trends easier to see.
- They are widely used in technical analysis candlesticks strategies.
- Heikin Ashi helps traders reduce market noise and minimize some false signals.
- Candle color and wick structure reveal market momentum.
- Understanding Heikin Ashi improves trend-following trading strategies.
What Are Heikin Ashi Candles?
If you’ve ever looked at a normal candlestick chart and felt overwhelmed by constant price fluctuations, you’re not alone. That’s exactly the problem Heikin Ashi candles were designed to solve.
The term Heikin Ashi comes from Japanese and roughly translates to “average bar.”
Instead of displaying raw price movements like traditional candlesticks, Heikin Ashi candles calculate average values. This smoothing effect helps you focus on the overall trend rather than small, random price swings.
For traders trying to identify direction quickly, this makes chart reading significantly easier.
How Heikin Ashi Candles Are Calculated
Unlike traditional candlesticks, Heikin Ashi candles use a modified formula that averages previous price data.
Important: Real Heikin Ashi Formula To fully understand how Heikin Ashi works, here is the actual formula used by trading platforms:
HA Close = (Open + High + Low + Close) / 4
HA Open = (Previous HA Open + Previous HA Close) / 2
HA High = Max (High, HA Open, HA Close)
HA Low = Min (Low, HA Open, HA Close)
This means every candle depends on previous data, which is why Heikin Ashi appears smoother but slightly delayed.
Why Traders Use Heikin Ashi Charts
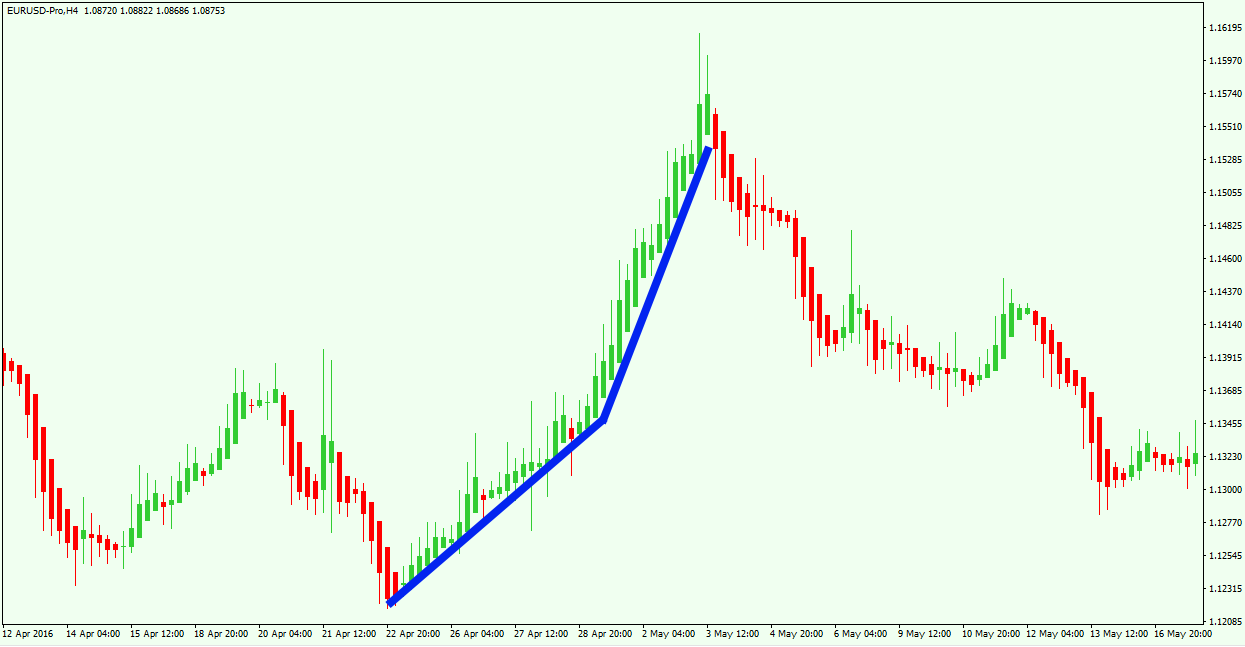
Once you start using Heikin Ashi candles, one of the first things you’ll notice is how much easier it becomes to spot trends.
Normal candlesticks constantly alternate between bullish and bearish candles, even during strong trends.
Heikin Ashi smooths these fluctuations, allowing trends to appear as long sequences of candles in the same direction.
For example:
- Strong uptrend → continuous bullish candles
- Strong downtrend → continuous bearish candles
This visual clarity helps traders stay in winning trades longer instead of exiting prematurely.
How to Read Heikin Ashi Candle Signals
Reading Heikin Ashi candles becomes intuitive once you know what to look for.
Here are the key signals traders watch for.
| Candle Appearance | Market Meaning |
| Strong bullish candle (no lower wick) | Powerful uptrend |
| Strong bearish candle (no upper wick) | Strong downtrend |
| Small candle with both wicks | Market indecision |
| Color change | Possible trend shift (requires confirmation) |
Important: A single color change is not a reliable reversal signal. Many traders wait for 2–3 consecutive candles or confirmation from indicators like RSI or MACD before acting.
When you start watching these patterns regularly, you’ll begin noticing how clearly momentum changes appear.
Try switching your chart to Heikin Ashi for a few trading sessions. You’ll quickly notice how much easier it becomes to identify trends.
Heikin Ashi vs Traditional Candlesticks
To fully understand Heikin Ashi, it helps to compare it with traditional candlestick trading patterns.
| Feature | Heikin Ashi | Traditional Candlesticks |
| Price Display | Averaged values | Actual market prices |
| Noise Level | Low | High |
| Trend Visibility | Clear | Sometimes unclear |
| Entry Precision | Moderate | High |
Traditional candles are better for precise entries and exits. Heikin Ashi, on the other hand, excels at identifying the overall market direction. Many traders combine both charts for a balanced approach.
Trends Using Heikin Ashi
If you’re asking yourself how to read Heikin Ashi candles effectively, the answer often lies in trend recognition.
Here’s how you can interpret common scenarios:
Strong Uptrend
- Long green candles
- Little or no lower wick
- Consecutive candles in same direction
This indicates strong buying pressure.
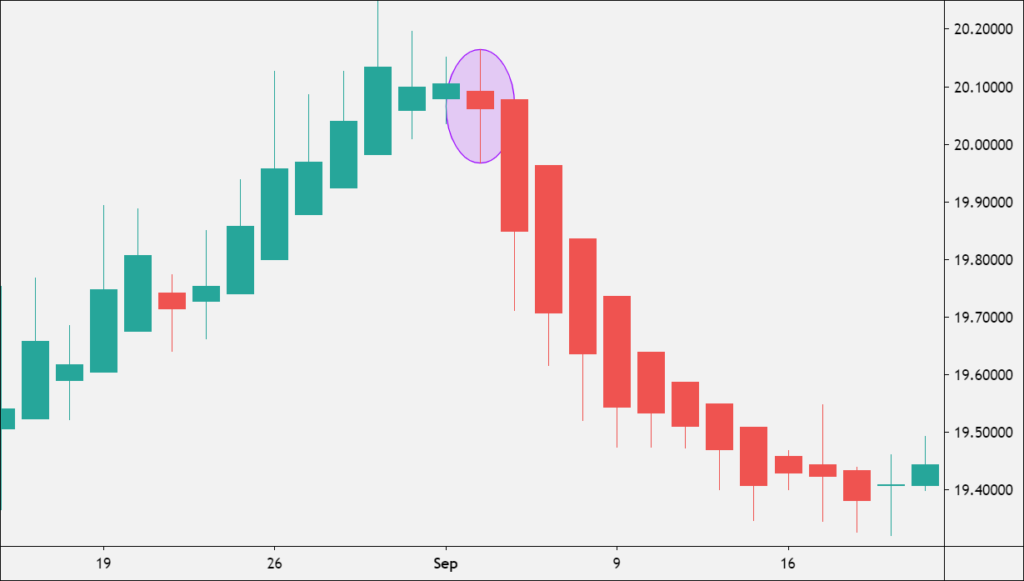
Strong Downtrend
- Long red candles
- Little or no upper wick
- Continuous bearish candles
This shows strong selling pressure.
Trend Weakening
- Smaller candles appear
- Upper and lower wicks grow
- Candle color starts alternating
These signs suggest the trend may be losing momentum.
Heikin Ashi in Trading Strategies
Heikin Ashi works especially well with trend-following strategies. Instead of reacting to every small price change, you focus on the broader market movement.
For example: A trader may stay in a long trade as long as candles remain bullish. Once a bearish candle appears after a long bullish run, it may signal a potential exit. This simple rule can help traders avoid exiting trades too early.
Improvement Tip: Instead of exiting on the first opposite candle, many traders wait for:
- 2–3 consecutive opposite candles
- Or confirmation from indicators like RSI or MACD
This reduces false exits and improves trade accuracy.
Heikin Ashi With Technical Indicators
Heikin Ashi becomes even more powerful when combined with other technical analysis candlestick tools.
Many traders combine it with:
- Moving averages
- RSI (Relative Strength Index)
- MACD momentum indicators
- Support and resistance zones
These tools help confirm whether the trend shown by Heikin Ashi is likely to continue.
The goal is to reduce false signals while improving timing.
When NOT to Use Heikin Ashi
Heikin Ashi is powerful, but it doesn’t work well in every situation.
Avoid using it in:
- Fast-moving news events
- Sideways or choppy markets
- Scalping or very short timeframes
Because Heikin Ashi smooths price data, it can hide sudden price movements and important signals needed in these conditions.
Risk Management When Using Heikin Ashi
Even with clear trends, risk management is essential.
- Always use stop-loss based on real candlestick levels
- Risk only 1–2% per trade
- Do not rely only on candle color
Because Heikin Ashi lags, sudden reversals can happen before signals appear.
Execution and Chart Clarity
When analyzing smoothed charts like Heikin Ashi, execution quality still matters. Clear pricing and stable platforms help traders respond effectively when trends appear.
Many traders prefer trading environments with tight spreads and reliable order execution while using technical strategies.
Platforms like Defcofx provide trading conditions designed to support technical analysis strategies, allowing traders to focus on interpreting chart signals rather than worrying about execution delays.
Now that you understand how to read Heikin Ashi trends, apply this strategy in real market conditions with a live trading account.
Open a Live Trading Account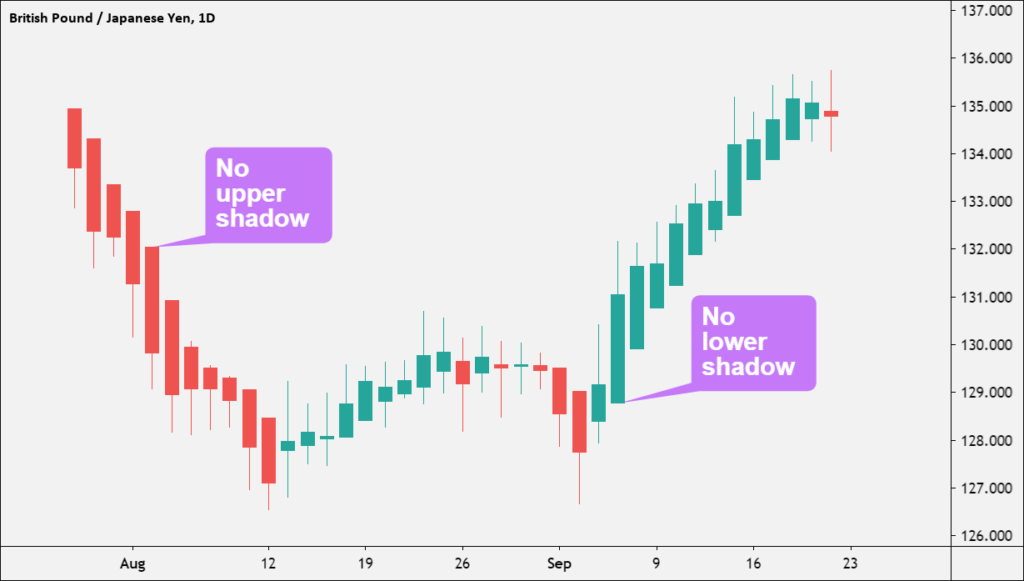
Frequently Asked Questions
What are Heikin Ashi candles?
Heikin Ashi candles are a type of chart used in technical analysis that smooths price data using averaged values. This makes trends easier to identify compared to traditional candlestick charts.
How do you read Heikin Ashi candles?
To read Heikin Ashi candles, observe candle color, wick length, and candle size. Continuous bullish candles indicate strong uptrends, while continuous bearish candles indicate strong downtrends.
Are Heikin Ashi candles better than normal candlesticks?
Heikin Ashi candles are better for identifying trends, while traditional candlesticks are better for precise entries and exits. Many traders combine both charts for a balanced trading approach.
Can beginners use Heikin Ashi charts?
Yes. Beginners often find Heikin Ashi easier to interpret because the smoothing effect removes market noise and highlights the overall trend direction.
Do Heikin Ashi candles lag the market?
Yes, slightly. Because they use averaged price data, Heikin Ashi signals may appear slightly later than traditional candlestick reversals.
What strategies work best with Heikin Ashi?
Trend-following strategies work best with Heikin Ashi candles because the smoothing effect helps traders stay in trades during sustained market movements.
Can Heikin Ashi be used for forex trading?
Yes. Heikin Ashi charts are widely used in forex trading because they simplify trend analysis and reduce confusion caused by short-term price fluctuations.
Final Thoughts
Learning how to read Heikin Ashi candles can make technical analysis much easier, especially if you struggle with noisy charts. By smoothing price data, Heikin Ashi helps you identify trends, momentum shifts, and potential reversals more clearly. While it should be combined with other tools for precise entries, this method remains one of the most effective ways to visualize market direction in modern trading.
Discover More Forex Guides With Defcofx
- What Is the 10000 Hour Rule in Forex Trading?
- Pairs Trading – Market-Neutral Stock & Forex Guide
- How Value of Currency Is Determined in the Forex Market
- How Many Countries Use Dollars?
- How Do You Invest in the US Dollar
- What Is Insider Trading?
- How Much Can I Earn From Trading per Month?
- When Should I Sell my Stock?
- Forex vs Stocks vs Crypto – Full Comparison Guide