


Moving Average (MA), Relative Strength Index (RSI), Moving Average Convergence/Divergence (MACD), Bollinger Bands, Average True Range (ATR), and Volume are the top indicators for index trading. For example, the US30, US100, S&P 500, FTSE 100, and DAX 40 are market indexes that traders can use technical indicators like momentum, volatility, and trend to make more educated trading decisions.
Key Points
- Moving averages are used to find trend direction.
- RSI is a momentum indicator that points to overbought or oversold conditions.
- MACD is useful for detecting trend changes and confirming momentum.
- Bollinger Bands are a measure of volatility and potential breakout scenarios.
- ATR allows traders to manage risk by quantifying market volatility.
- It is often better to use multiple indicators than just one for better signals.
1. Moving Average (MA)
Moving averages are one of the most popular indicators in the financial markets, because they clearly show the general direction of a trend. Instead of reacting to each price change, a moving average makes price fluctuations less dramatic so you can more easily determine whether buyers or sellers are in control.
When the market is trading above the moving average, it is often a sign of bullish momentum. Usually the bearish momentum is stronger when the prices are trading below it.
Many traders use combinations of 20 day, 50 day and 200 day moving averages to determine short and long term trends. Moving average crossovers are also popular to confirm potential trend change.
The indicator works very well when the indices are in a strong trend but does not work as well in choppy or sideways markets.
2. Relative Strength Index (RSI)
The Relative Strength Index (RSI) is a momentum oscillator that measures the velocity and magnitude of directional price movements.
- The RSI is between 0 and 100.
- Levels above 70 are frequently viewed as overbought.
- Often below 30 indicates over-sold conditions.
Many traders make the mistake of thinking that if the RSI is above 70 it’s time to sell. Strong markets can actually remain overbought for a long time. Similarly, weak markets can remain oversold for much longer than expected.
Many experienced traders don’t use RSI as a standalone signal, but in combination with trend analysis and support or resistance levels.
The RSI works particularly well on volatile indices like the US100 (NASDAQ 100) where momentum often turns after economic news or tech earnings.
3. MACD (Moving Average Convergence Divergence)
The MACD is a popular tool among swing traders, combining trend-following and momentum analysis into one indicator.
It is in three parts:
- MACD Line Signal Line Histogram
- A possible indication of bullish momentum is when the MACD Line crosses over the Signal Line. A decline in price momentum might be indicated by a crossing under the signal line.
- The histogram allows traders to know if momentum is growing or weakening prior to large price moves.
MACD is best used on indices that develop sustained trends, such as the US30 and S&P 500.
4. Bollinger Bands
Bollinger Bands are designed to measure the market volatility.
The indicator has three lines.
- Top band
- Middle Moving Average
- Lower Range
The bands expand when volatility increases. They contract during calmer market conditions.
Traders frequently employ Bollinger Bands to spot possible breakout chances during periods of low volatility. Some people use them to check if prices have briefly deviated too much from their average.
But a touch of the upper or lower band is not an automatic sign for reversal. Long periods can pass, where strong trends just hug one side of the bands.
When coupled with other momentum or price action indicators, Bollinger Bands become a potent tool for confirming market movements.
5. Average True Range (ATR)
The Average True Range (ATR) indicator is different from many other indicators in that it does not try to predict the direction of the market. Rather it measures how much an index typically moves in a given period.
Higher ATR readings mean higher volatility, and lower readings mean calmer market conditions.
ATR is used by many traders to:
- Stop-loss levels
- Position sizing calculator
- Daily Price Action Calculation
- Don’t put stops too tight to normal market moves
ATR is particularly useful for index traders because volatility may change dramatically during economic announcements and earnings season.
6. Volume Indicators
Volume provides a clear indication of market participation and the intensity of trading activity.
While index CFDs lack the centralized exchange volume found in equities, many platforms utilize tick volume as a proxy, calculating activity through the frequency of price updates.
Trading volume serves as a critical tool for validating:
- Price breakouts
- The persistence of trends
- Potential market reversals
- Levels of institutional involvement
If the US30 penetrates a key resistance zone on high volume, for instance, the move is often considered far more credible than a breakout supported by minimal participation.
Integrating volume analysis with trend-following tools like moving averages or the MACD offers an extra layer of confirmation prior to trade execution.
Which indicator is best for beginners?
There is no universal “best” indicator because every trader has different goals and strategies. However, some indicators are easier to understand than others.
| Indicator | Purpose | Beginner Friendly |
| Moving Average | Trend identification | ⭐⭐⭐⭐⭐ |
| RSI | Momentum | ⭐⭐⭐⭐⭐ |
| MACD | Trend confirmation | ⭐⭐⭐⭐ |
| Bollinger Bands | Volatility | ⭐⭐⭐ |
| ATR | Risk management | ⭐⭐⭐⭐ |
| Volume | Trade confirmation | ⭐⭐⭐⭐ |
For beginners, a combination of a moving average and RSI provides a solid foundation for understanding both trend direction and market momentum without making charts overly complicated.
Should you use multiple indicators together?
Yes, but only if they match each other.
One of the biggest mistakes traders make is filling up their charts with indicators all measuring the same thing. This often results in mixed messages and unnecessary confusion.
Rather, many experienced traders use combinations of indicators analyzing different aspects of the market.
as, for example:
- Moving Average > Trend
- Momentum → RSI
- ATR → Volatility (Volatilité)
- Confirmation → Volume
This combination gives a more complete picture of market conditions and avoids unnecessary complexity.
Trade smarter with the right platform
The best indicators are only effective when paired with a reliable trading platform that provides accurate charts, fast execution, and access to global markets.
With Defcofx, traders can analyze and trade popular indices such as the US30, US100, S&P 500, FTSE 100, and DAX 40 using MetaTrader 5. The platform offers spreads from 0.3 pips, commission-free trading, leverage of up to 1:2000, and withdrawals processed within four business hours, giving traders the tools they need to execute their strategies efficiently.
Open a Live Trading Account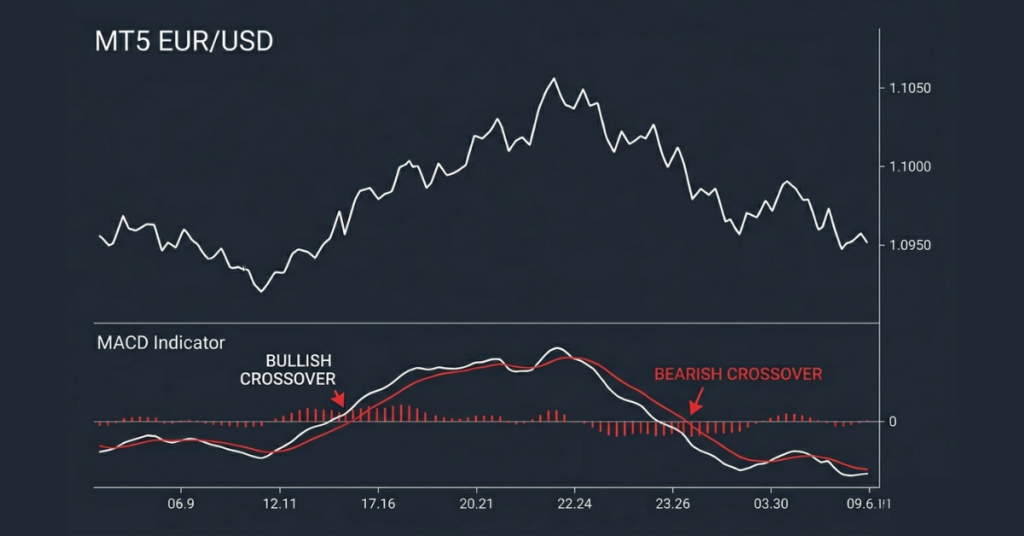
Common Mistakes When Using Indicators
| Common Mistake | Why It’s a Problem | Better Approach |
| Expecting perfect buy and sell signals | Indicators are not designed to predict every market move. No indicator is accurate 100% of the time. | Use indicators to support your analysis, not as the sole basis for trading decisions. |
| Changing indicator settings after every losing trade | Constant adjustments can lead to inconsistent strategies and unreliable results. | Test your strategy over a large number of trades before making meaningful changes. |
| Ignoring economic news | Major events, such as interest rate decisions or inflation reports, can quickly override technical signals. | Monitor the economic calendar and consider market-moving news before entering trades. |
| Relying only on indicators | Ignoring price action can limit your understanding of market trends, support and resistance, and overall market structure. | Combine indicators with price action analysis for a more complete view of the market. |
Final Thoughts
Best indicators for index trading are moving average, RSI, MACD, Bollinger Bands, ATR and volume indicators. These indicators provide useful information about the direction of the trend, momentum, volatility and market participation.
Successful traders don’t look for one perfect indicator but use complementary tools, along with solid risk management and price action analysis.
The introduction of a reliable trading platform and the development of a trustworthy strategy enable traders to make better decisions on all the key indexes such as US30, US100, S&P 500, FTSE 100 and DAX 40.
Frequently Asked Questions
Best indicator for trading indices?
Among the most popular indicators, Moving Averages clearly identify market trends and help traders to avoid trading against the prevailing direction.
Is RSI good indicator for index trading?
Yes, RSI is a popular indicator for momentum and potential overbought or oversold conditions, especially on volatile indices like the US100.
Can I use multiple indicators?
Yes. Many traders combine indicators that measure different aspects of the market, such as trend, momentum, and volatility, to improve the quality of their analysis.
What are good indicators for beginners?
Moving Averages and RSI are good indicators for beginners because they are easy to understand and provide useful information about market direction and momentum.
Do pro traders use technical indicators?
Many professional traders use indicators as part of their trading strategy, but they also look at price action, market structure, economic news, and risk management before they take trading decisions.
Market indicators: Can they predict the market?
No. Indicators are based on analyzing past price data to find probabilities and trends, but they cannot guarantee what the market will do in the future.
What indicator is best for volatile markets?
ATR and Bollinger Bands are particularly useful during periods of volatility as they measure market volatility and help traders adjust their risk management accordingly