


Traders use different tools to find good price levels for buying and selling. One of these tools is camarilla pivot points. These pivot points help traders see where prices might reverse or continue in the same direction. Many traders like them because they adjust to market volatility.
This guide will explain how camarilla pivot points work, how to calculate them, and how traders use them in real markets. We will also compare them with other pivot points and share some trading strategies.
What Are Camarilla Pivot Points?
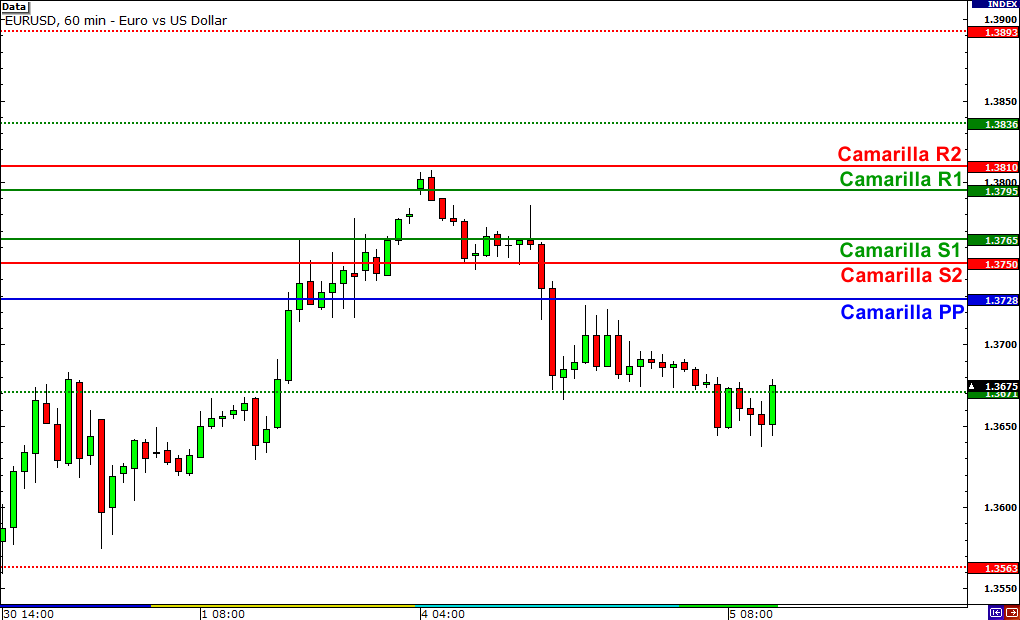
Camarilla pivot points are a set of levels that help traders find support and resistance. These levels are based on the previous day’s high, low, and close prices. Unlike regular pivot points, camarilla levels focus on short-term price movements. They are useful for day traders and scalpers.
There are eight key levels in camarilla pivot points:
- Four resistance levels (R1, R2, R3, R4)
- Four support levels (S1, S2, S3, S4)
The most important levels are S3 and R3. These levels often act as turning points where prices either reverse or break out.

How to Calculate Camarilla Pivot Points
The formula for camarilla pivot points is simple. Here’s how they are calculated:
- R4 = (High – Low) × 1.1 / 2 + Close
- R3 = (High – Low) × 1.1 / 4 + Close
- R2 = (High – Low) × 1.1 / 6 + Close
- R1 = (High – Low) × 1.1 / 12 + Close
- S1 = Close – (High – Low) × 1.1 / 12
- S2 = Close – (High – Low) × 1.1 / 6
- S3 = Close – (High – Low) × 1.1 / 4
- S4 = Close – (High – Low) × 1.1 / 2
Traders use these formulas to calculate the levels for the next trading day. Many trading platforms, like MetaTrader 4 and 5, have built-in tools that calculate these levels automatically.
How Traders Use Camarilla Pivot Points
1. Trading the Reversal Strategy
One common strategy is to trade price reversals at S3 and R3 levels. Here’s how it works:
- If the price reaches S3, traders expect a bounce upward and look for buy signals.
- If the price reaches R3, traders expect a drop downward and look for sell signals.
- A stop loss is usually placed slightly below S4 for long trades and above R4 for short trades.
This strategy works well in range-bound markets, where price moves between support and resistance levels.
2. Trading the Breakout Strategy
If the price breaks through R3 or S3, it can signal a strong move in that direction. Traders wait for a breakout and trade in the direction of the move.
- If the price breaks above R3, traders enter a buy trade, expecting the price to reach R4.
- If the price breaks below S3, traders enter a sell trade, expecting the price to reach S4.
This strategy is useful when the market is trending.
3. Combining with Other Indicators
Traders often use camarilla pivot points with other tools to improve accuracy. Some popular combinations include:
- Moving Averages: To confirm the trend direction.
- Relative Strength Index (RSI): To check if the market is overbought or oversold.
- Volume Indicators: To confirm breakout strength.
Using multiple indicators helps reduce false signals.
Camarilla vs. Standard vs. Fibonacci Pivot Points
Many traders compare camarilla pivot points with other types of pivot points. Here’s how they differ:
| Feature | Camarilla Pivot Points | Standard Pivot Points | Fibonacci Pivot Points |
| Best for | Short-term trading | All market conditions | Trend-following strategies |
| Key Levels | S1-S4, R1-R4 | One pivot, three support, three resistance levels | Uses Fibonacci ratios |
| Volatility Adjustment | High | Low | Medium |
| Common Usage | Scalping, day trading | Swing trading, position trading | Reversal confirmation |
Camarilla pivot points are best for traders who need frequent support and resistance levels in fast-moving markets.
Advanced Trading Strategies Using Camarilla Pivot Points
1. Trading False Breakouts at R3 and S3
While most traders focus on breakouts, false breakouts can also create good trading opportunities. A false breakout happens when the price moves past a key level (like R3 or S3) but then reverses in the opposite direction.
- If the price briefly breaks above R3 but then falls back below, it could signal a shorting opportunity.
- If the price drops below S3 and quickly bounces back above, traders can enter a long trade.
To confirm a false breakout, traders use:
- Candlestick patterns like pin bars or engulfing candles.
- Lower timeframes (like 5-minute or 15-minute charts) to spot reversal signals.
- Volume indicators to see if the breakout lacked strong buying or selling pressure.
2. Scalping with Camarilla Pivot Points
Scalping is a strategy where traders open and close trades quickly, often within minutes. Camarilla pivot points provide tight support and resistance levels, making them useful for scalping.
- Scalpers enter trades at R1, R2, S1, or S2 for small price moves.
- Stop losses are set just beyond the next pivot level to reduce risk.
- Trades are closed as soon as price moves a few pips in profit to lock in gains.
Scalping works best in high-volume trading sessions, such as the London or New York open.
3. Combining Camarilla Pivot Points with Bollinger Bands
Bollinger Bands measure market volatility and help traders spot overbought and oversold conditions. When used with camarilla pivot points, they create a strong trading system:
- If price touches R3 or S3 while also reaching the upper or lower Bollinger Band, traders expect a reversal.
- If price breaks R3 or S3 and stays outside the Bollinger Bands, it confirms a strong breakout.
- Stop losses can be placed near the midline of the Bollinger Bands to protect trades.
This strategy is useful in volatile forex pairs like GBP/USD or USD/JPY.

Real-Life Case Studies: Camarilla Pivot Points in Action
1. How a Forex Trader Used Camarilla Levels for a Profitable USD/JPY Trade
A trader spotted the USD/JPY pair approaching S3 on the daily chart. Here’s how they planned the trade:
- The RSI showed oversold conditions, signaling a possible bounce.
- The trader placed a buy order slightly above S3, expecting a reversal.
- A stop loss was placed below S4 in case the price continued dropping.
- The price bounced back to R2, allowing the trader to exit with a 2.5:1 risk-reward ratio.
This case shows how traders can use camarilla pivot points to time reversals effectively.
2. Camarilla Breakout Strategy in Crude Oil Trading
Crude oil is a highly volatile market, making it a great candidate for breakout strategies. In this case, a trader used camarilla pivot points to trade a breakout above R3.
- The price had been consolidating near R3 for two days.
- On the third day, a strong volume spike led to a breakout above R3.
- The trader entered a long position with a target at R4.
- A stop loss was placed just below R3 in case of a false breakout.
The price hit R4 within hours, yielding a successful breakout trade.
Camarilla Pivot Points in Different Market Conditions
1. Using Camarilla Pivots in Trending Markets
In a strong uptrend or downtrend, camarilla pivot points help traders find pullback entries.
- In an uptrend, traders look for buy opportunities near S1 or S2, using them as support.
- In a downtrend, traders wait for the price to touch R1 or R2, using them as resistance.
This approach works well with moving averages to confirm the trend direction.
2. Trading Sideways Markets with Camarilla Levels
In range-bound conditions, price moves between support and resistance without clear direction.
- Traders buy near S3 and sell near R3, expecting the price to stay within the range.
- If price breaks above R4 or below S4, it signals a potential trend change.
This strategy is effective in Asian trading sessions, where price often stays in a tight range.
Why Smart Money Uses Camarilla Pivot Points
1. How Institutional Traders Apply Camarilla Levels
Institutional traders, like hedge funds and banks, don’t just rely on one trading tool. They combine camarilla pivot points with order flow analysis and liquidity zones.
- Liquidity traps: Institutions look for stop-loss clusters near S3 and R3 to trigger fake breakouts before moving in the real direction.
- Volume confirmation: Institutions use large order flows to confirm breakout strength at R3 or S3.
- Multi-timeframe analysis: Hedge funds often track camarilla levels on hourly, daily, and weekly charts to spot high-probability trades.
2. Why Market Makers Watch These Levels
Market makers provide liquidity to the market. They use camarilla pivot points to set their bid and ask prices near key levels.
- When price nears S3 or R3, market makers adjust spreads, anticipating trader orders.
- Market makers use R4 and S4 as extreme zones, where they may widen spreads to limit risk.
Understanding how big players use these levels gives retail traders an edge.
Automating Camarilla Pivot Point Trading
1. Using Expert Advisors (EAs) in MetaTrader
Traders can use Expert Advisors (EAs) in MT4 and MT5 to trade camarilla levels automatically.
- The EA places trades when price touches S3 or R3.
- It can close trades automatically if the price reaches S4 or R4.
- Some EAs even adjust stop losses dynamically to lock in profits.
Automating trading helps remove emotions and improves execution speed.
2. Custom Indicators for TradingView
TradingView allows traders to code custom camarilla indicators for more precise setups.
- Custom scripts can highlight key pivot levels automatically.
- Alerts can notify traders when price reaches S3 or R3.
- Some indicators even predict next-day levels using real-time data.
These tools make trading more efficient, especially for high-frequency traders.
Common Mistakes When Using Camarilla Pivot Points
1. Ignoring Market Conditions
Camarilla pivot points work best in volatile markets. Using them in low-volatility conditions may lead to false signals.
2. Not Using Stop Losses
Placing trades without stop losses can lead to big losses, especially if a breakout fails.
3. Overtrading Every Level
Not all pivot levels are tradable. Focus on S3 and R3 for reversals and S4 and R4 for breakouts.
Conclusion
Camarilla pivot points are a powerful tool for short-term traders. They provide precise support and resistance levels, helping traders plan entries and exits. Whether trading reversals or breakouts, these levels offer a structured approach to the market.
For traders looking for a reliable trading platform, Defcofx offers MetaTrader 5 with built-in pivot point tools. With high leverage up to 1:2000, no commissions, and fast withdrawals, Defcofx is a great choice for traders who want to use camarilla pivot points effectively.
FAQ: Camarilla Pivot Points
- Are camarilla pivot points good for all traders?
They are best for day traders and scalpers who trade short-term price movements.
- Can I use camarilla pivot points in forex trading?
Yes, these levels work well in forex, stocks, and commodities.
- How often should I calculate camarilla pivot points?
They should be calculated daily using the previous day’s high, low, and close.
- Do camarilla pivot points work in trending markets?
They work better in range-bound markets, but breakout traders can use them in trends.
- Can I automate camarilla pivot points on MetaTrader?
Yes, many indicators and scripts calculate these levels automatically on MetaTrader 4 and 5.
Forex Articles You Can’t Miss
Expand your forex expertise with these must-read articles: