


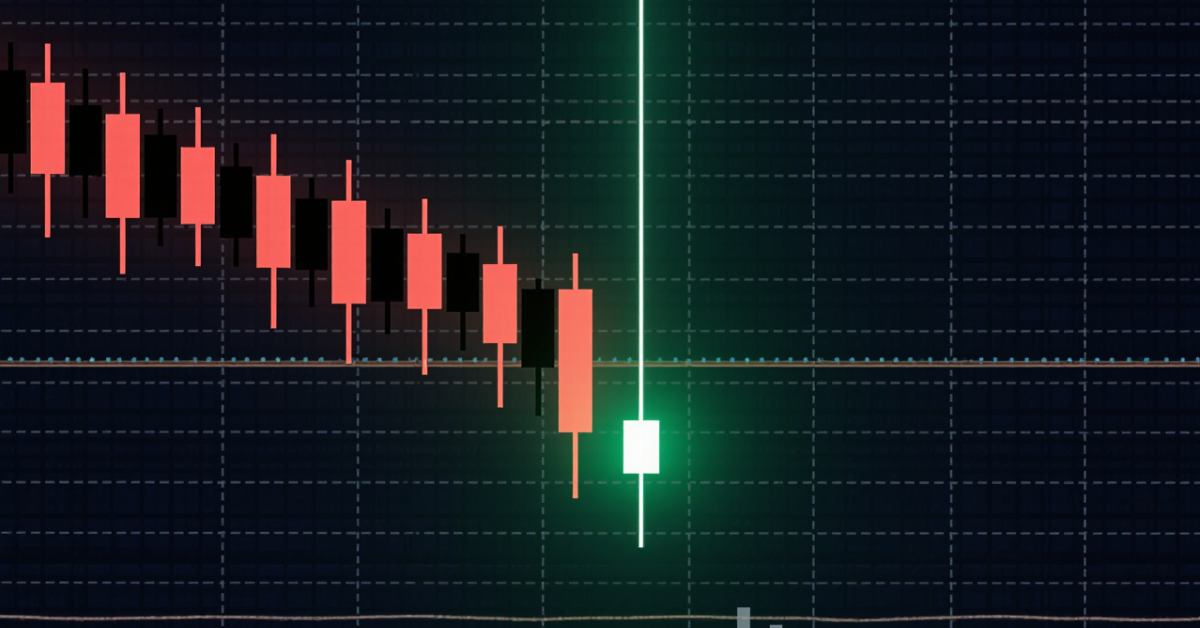
An inverted hammer candlestick is a single-bar bullish reversal signal that forms after a downtrend: a small real body with a long upper wick and little or no lower shadow. It shows buyers testing higher prices; traders wait for bullish confirmation (next candle closing above the high) before entering.
Key Takeaways
- The inverted hammer candlestick signals a potential bullish reversal after a downtrend.
- It has a small body, a long upper wick, and little to no lower shadow.
- Confirmation is crucial; look for the next candle closing above the inverted hammer’s high.
- The pattern reflects buyer strength emerging after heavy selling.
- Works best when combined with indicators like RSI, MACD, or volume.
- Effective across forex, stocks, and crypto markets, especially on higher timeframes.
What Is an Inverted Hammer Candlestick?
An inverted hammer candlestick is a technical pattern that appears after a downtrend and suggests a possible bullish reversal. It has a small real body at the lower end of the price range and a long upper shadow that is at least twice the size of the body, showing that buyers attempted to push prices higher during the session.
An inverted hammer candle indicates that sellers dominated early on, but buyers stepped in aggressively before the close, a potential sign that selling pressure is weakening. However, the pattern alone doesn’t confirm a reversal; it must be validated by a subsequent bullish candle closing above the inverted hammer’s high.
In practice, the inverted hammer can appear on any timeframe from 1-minute charts to daily or weekly, but its signal tends to be stronger on higher timeframes where market noise is reduced.
How to Identify an Inverted Hammer
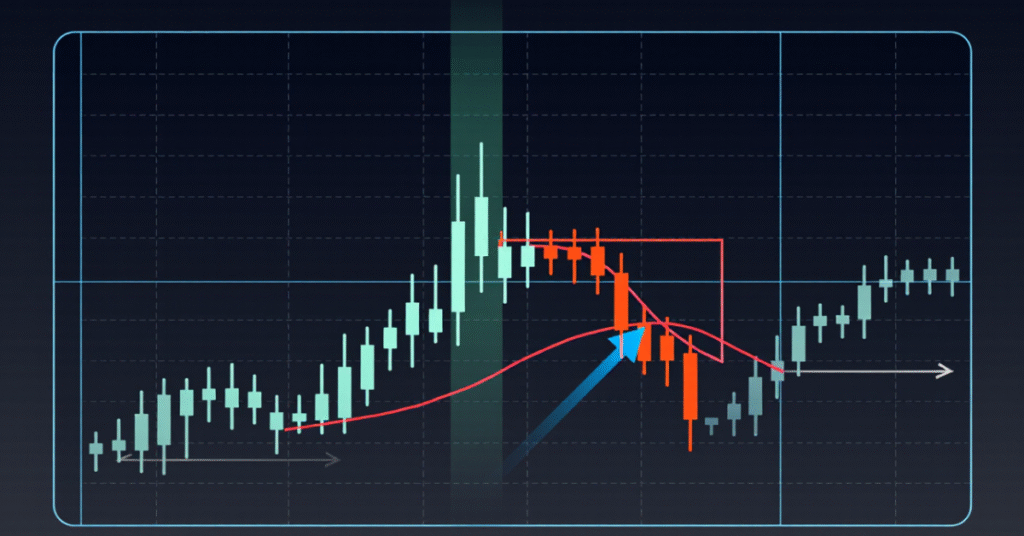
Identifying an inverted hammer on a price chart is straightforward once you understand its defining features. It is crucial, however, to ensure that it appears after a clear downtrend, since its meaning changes entirely if found in an uptrend (where it becomes a shooting star).
5 Key Characteristics:
- Small real body: located near the lower end of the candle’s range.
- Long upper shadow: at least two to three times the size of the body.
- Little or no lower shadow: showing sellers couldn’t push prices much lower.
- Appears after a decline: otherwise, it’s not considered a bullish signal.
- Needs confirmation: the next candle must close above the high of the inverted hammer.
Example Scenario: Imagine EUR/USD has been falling for several sessions. On the daily chart, a small-bodied candle with a long upper wick forms, showing buyers pushed the price up but couldn’t sustain it. The next day, a strong bullish candle closes above that high, confirming the inverted hammer and signaling a potential reversal.
When these criteria are met, the inverted hammer becomes one of the most reliable early warning signs that bearish momentum is weakening.
Market Psychology Behind the Inverted Hammer
The inverted hammer candlestick is more than just a chart shape; it’s a window into market sentiment and trader psychology. Understanding why it forms helps you read momentum shifts before they become obvious.
When a downtrend has been in motion, sellers dominate, driving prices lower. During the formation of the inverted hammer, the market initially continues downward, but then buyers push prices significantly higher, creating a long upper wick. However, they can’t maintain full control, and the candle closes slightly below or near the open.
This price action tells a powerful story:
- Sellers are losing strength. Despite early control, they couldn’t sustain new lows.
- Buyers are testing control. The long upper shadow shows strong buying interest entering the market.
- Indecision is forming. Neither side fully wins, signaling a possible shift in momentum.
Red vs Green Inverted Hammer
- A green (bullish) inverted hammer opens lower and closes higher, showing stronger buying conviction.
- A red (bearish) inverted hammer is still valid but suggests a weaker buying attempt; stronger confirmation is required.
Traders interpret this candle as a first hint of reversal, but only confirmation from the next session can validate it. The following bullish candle essentially says, “Buyers have taken control.”
How to Trade the Inverted Hammer Pattern
Trading the inverted hammer candlestick effectively requires more than just spotting it. Success comes from confirmation, timing, and disciplined risk management. Below is a structured, professional approach traders use to build entries around this pattern.
Step-by-Step Guide to Trading the Inverted Hammer
1. Identify a clear downtrend: The pattern only holds value when it appears after multiple consecutive bearish candles or a strong decline in price.
2. Spot the inverted hammer formation: Confirm it visually: small body, long upper wick (2–3x the body), little or no lower shadow.
3. Wait for confirmation: A bullish candle closing above the inverted hammer’s high is essential before entering any trade. This confirms buyer strength.
4. Entry point: Enter a buy trade slightly above the high of the confirmation candle to avoid false breakouts.
5. Stop-loss placement: Place your stop-loss below the low of the inverted hammer candle this protects against fake reversals.
6. Take-profit target: Look toward the nearest resistance level or 1.5–2x your risk distance for a balanced risk/reward ratio.
7. Optional confirmation tools:
- RSI Divergence: If RSI rises while price forms an inverted hammer, it signals fading bearish pressure.
- MACD Crossover: A bullish crossover soon after strengthens the setup.
- Volume Spike: Rising volume adds conviction that buyers are entering.
Confirmation Candles & Indicators
The inverted hammer candlestick is powerful, but confirmation is what transforms it from a potential reversal hint into a reliable trading signal. Confirmation validates that buyers are stepping in after a downtrend and that momentum is shifting.
What Counts as Confirmation?
A confirmation candle is a bullish candle that closes above the high of the inverted hammer. It must show:
- A strong bullish body (preferably twice the size of the hammer’s body).
- A close above the previous high, showing buyers are in control.
- Ideally, higher volume than the preceding few candles.
When these factors align, the pattern confirms a possible trend reversal or short-term bounce.
4 Best Indicators to Use with the Inverted Hammer
The inverted hammer is a powerful bullish reversal candlestick pattern, but relying on it alone can lead to false signals. To increase accuracy, traders often combine it with technical indicators that confirm market momentum, strength, and key price zones. Below are four of the most effective indicators to use alongside the inverted hammer for reliable trade confirmations.
1. Relative Strength Index (RSI)
The RSI helps measure the momentum behind price movements and determines whether an asset is overbought or oversold. When used with an inverted hammer, RSI offers valuable confirmation of a potential trend reversal.
- Bullish Divergence: Look for situations where the price forms lower lows while the RSI forms higher lows, this indicates weakening selling pressure and growing bullish momentum.
- RSI Crossing 30 Upward: If the RSI crosses above the 30 level (coming from oversold territory) shortly after the inverted hammer appears, it strengthens the case for a bullish reversal.
Ideal Setup: An inverted hammer forming near a support zone, followed by an RSI move from 25 to 35, is a classic early signal of a possible upward trend reversal.
2. Moving Average Convergence Divergence (MACD)
The MACD indicator identifies shifts in trend momentum and helps confirm the direction of the new trend after the inverted hammer appears.
- Bullish Crossover: A key signal occurs when the MACD line crosses above the signal line, suggesting that bullish momentum is gaining strength.
- Zero-Line Rejection: When the MACD histogram begins turning positive, it adds further confidence that a reversal is taking shape.
Best Practice: Combine the inverted hammer with a recent MACD crossover to validate entry points and filter out false reversals, especially in volatile markets.
3. Volume Indicator
Volume is often considered the “fuel” behind price movement. It provides insight into the conviction of market participants following an inverted hammer.
- High Volume on the Inverted Hammer: A noticeable volume spike during the formation of the inverted hammer indicates strong buying interest, even if the session closes near its open.
- Confirmation Candle Volume: When the next candle (the confirmation candle) also shows above-average volume and a bullish close, it confirms that buyers have taken control.
4. Support and Resistance Levels
Support and resistance zones are fundamental in determining where price reversals are most likely to occur.
- Inverted Hammer at Support: When the inverted hammer forms near a key support level, it indicates that buyers are stepping in to defend that area, making the reversal setup far more credible.
- Resistance Breakout Confirmation: If the inverted hammer is followed by a strong bullish candle breaking above minor resistance, it often marks the start of a new uptrend.
- Combination Strategy: Pairing the inverted hammer with strong support zones (identified through horizontal levels or Fibonacci retracements) enhances the probability of successful entries.
Trade Smarter with Defcofx
Access professional charting tools, real-time indicators, and reliable execution to make informed decisions.
Enhance your trading with Defcofx5 Common Mistakes Traders Make with Inverted Hammer Candlesticks
Even though the inverted hammer is a simple and reliable pattern, many traders misuse it leading to false signals, premature entries, or avoidable losses. Let’s look at the most common errors and how to prevent them.
1. Trading Without Confirmation
Jumping in immediately after spotting the inverted hammer is the most frequent mistake.
- Why it’s risky: Without a confirming bullish candle, the market may continue falling.
- Fix: Always wait for a bullish close above the hammer’s high before entering.
2. Ignoring the Overall Trend
The inverted hammer must appear after a downtrend to signal a bullish reversal.
- If it appears in an uptrend, it becomes a shooting star, a bearish pattern.
- Always check the trend context before labeling the candle.
3. Setting Improper Stop-Loss Levels
Many traders place stop-losses too close, causing early exits due to market volatility.
- Fix: Set your stop-loss below the low of the inverted hammer for proper breathing room.
4. Overlooking Volume and Indicators
A valid reversal setup often coincides with volume spikes or indicator divergence.
- Fix: Use RSI, MACD, or Stochastic to confirm momentum change.
5. Ignoring Trading Costs and Execution Speed
Even perfect setups can fail due to high spreads, commissions, or slow order execution.
- Fix: Use a broker with no commissions, low spreads (from 0.3 pips), and fast execution to optimize results.
Conclusion: Mastering the Inverted Hammer for Confident Trading
The inverted hammer candlestick stands as one of the most reliable early indicators of a potential bullish reversal, but only when used with discipline and proper confirmation. It visually captures a critical turning point where buyers begin to regain control after prolonged selling pressure, signaling that bearish momentum may be weakening.
However, no single candle guarantees a trend change. The real power of the inverted hammer emerges when it’s supported by technical confirmations like RSI divergence, a MACD bullish crossover, or high-volume participation. Traders who wait for a confirmation candle closing above the hammer’s high and align entries with strong support zones significantly improve their success rate.
Proper risk management, including balanced stop-loss and take-profit placement, ensures the pattern’s potential translates into consistent results rather than random outcomes. When combined with patience and technical confluence, the inverted hammer becomes a strategic edge, not just a visual signal, in your trading arsenal.
Empower your strategy with precision tools.
Access advanced charting, real-time confirmations, and professional execution to make every signal count.
Trade Confidently with DefcofxFrequently Asked Questions (FAQs) Inverted Hammer Candlestick
An inverted hammer candlestick signals a potential bullish reversal after a downtrend. It shows that buyers tried to push the price higher but faced resistance. If the next candle closes above the inverted hammer’s high, it confirms buyer control and a possible trend reversal.
Both look identical, but context matters.
1. The inverted hammer forms after a downtrend, signaling a bullish reversal.
2. The shooting star forms after an uptrend, signaling a bearish reversal.
Yes, especially on higher timeframes (4-hour, daily, or weekly charts). When paired with confirmation and volume analysis, it’s a strong signal for reversals in forex pairs like EUR/USD, GBP/USD, and XAU/USD.
No. Always wait for confirmation of a bullish candle closing above the inverted hammer’s high. Entering early can result in losses if the downtrend continues.
The most effective ones include
1. RSI (Relative Strength Index), for identifying momentum divergence.
2. MACD, to confirm bullish crossover.
3. Volume indicators, to detect real buying strength.
Place a stop-loss below the low of the inverted hammer candle and target at least 1.5–2x your risk. This ensures a balanced risk/reward ratio.
Because Defcofx enhances trading precision and profitability through:
1. High Leverage Options: up to 1:2000.
2. 40% Welcome Bonus on deposits above $1000.
3. No commissions or swap fees with low spreads from 0.3 pips.
4. Global Reach: clients from all countries, multiple languages.
5. Fast Support & Withdrawals: processed within 4 business hours, even on weekends.
Defcofx Forex Articles You Shouldn’t Miss
Discover powerful forex strategies in these top reads from Defcofx.