


The week kicks off in high-voltage mode as central-bank shocks and technical breakouts collide. Traders are braced for fireworks after last week’s dovish Fed (25bps cut to 4.25%) versus a steady BoE at 4.00%. The Federal Reserve’s move briefly catapulted EUR/USD above 1.19 before paring gains, while GBP/USD spiked into the 1.37 range before Brexit-budget jitters dragged it back under 1.35. At the same time, Canada’s cooler economy (GDP contraction, jobs loss) fueled BoC easing bets, tilting USD/CAD technicals.
Key catalysts this week include FOMC and BoC speeches, UK/Eurozone data, and an ECB non-monetary meeting. Traders will watch breakout patterns and trend flips alongside momentum indicators (RSI above 70 = overbought; MACD crossovers for trend shifts). In short: Monday’s open could see surprise reversals and critical level tests.
EUR/USD
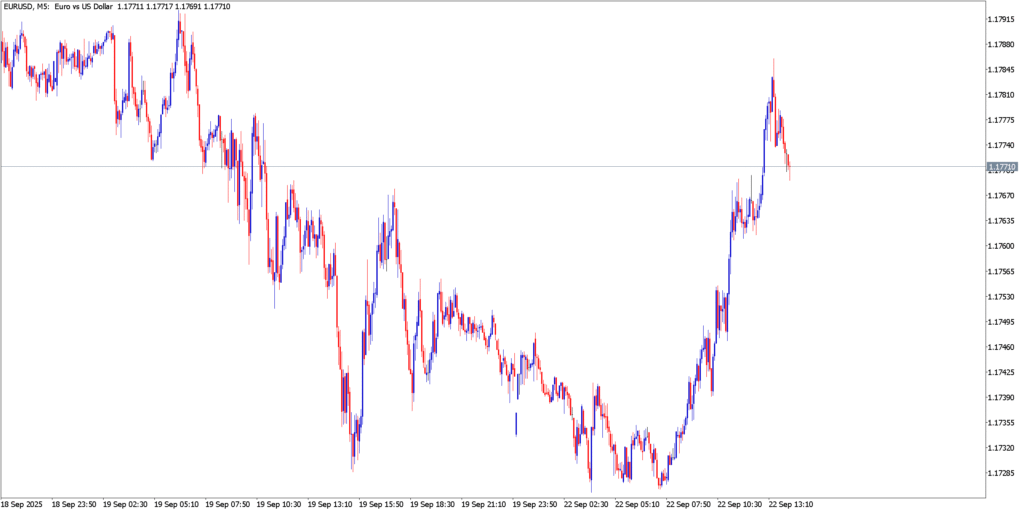
After dropping to ~1.1720 support last week, EUR/USD staged a sharp reversal Monday morning. Price broke above the recent downtrend (roughly 1.1750) and soared to ~1.1785. This looks like a classic double-bottom rebound: support around 1.1720 held firm, then a quick surge. A clean daily close above 1.1775–1.1780 would confirm a breakout; failure could snap back to 1.1720. Key near-term pivot points: support ~1.1720 (double bottom) and resistance ~1.1800 (last high).
- Breakout Alert – Monday’s high (~1.1785) tests a resistance trendline. If bulls push through 1.1800–1.1820, the next target is 1.1850+ (multi-day highs).
- Momentum – Indicators likely flash bullish: RSI would be near overbought (>70) after that pop. A sustained MACD crossover above zero would cement upward momentum.
- Reversal Risk – Overextended RSI or a bearish MACD divergence could trigger a pullback. Watch if EUR/USD fails to hold 1.1750 after this spike.
Fundamentals
The Fed’s surprise cut to 4.25% while ECB holds is the main tailwind for EUR/USD. Analysts note the dollar is under “multiple cuts” pressure. If this Fed-euro rate gap persists, EUR/USD may press higher. However, even RBC’s bullish 1.24 by 2026 forecast is cautious in the near-term. For Monday, technicals rule: a break above resistance could spark a follow-through rally, while an RSI-driven pullback could see a quick retrace to 1.1720.
GBP/USD
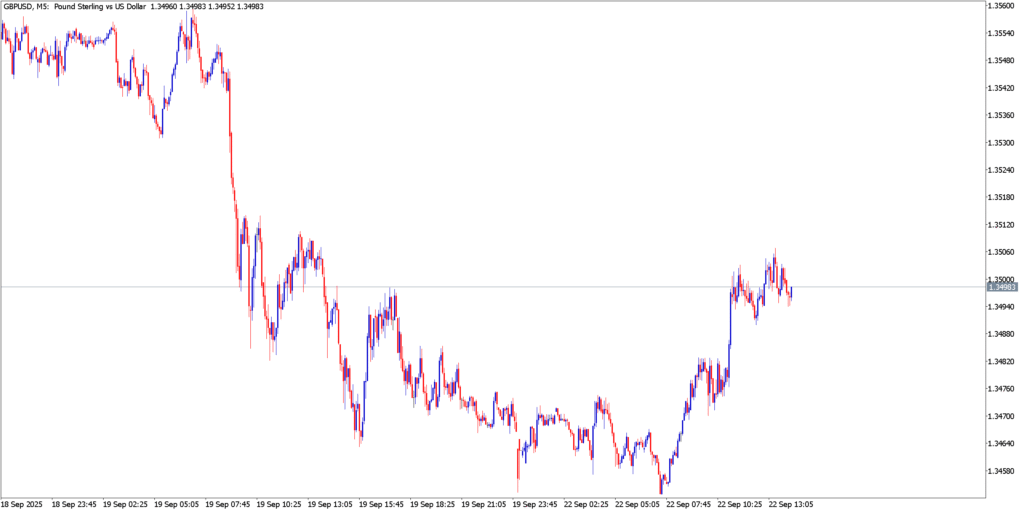
Last week’s action left GBP/USD battered by UK budget concerns. On Sep 19 it crashed from ~1.3560 to ~1.3450, then consolidated. Monday opened near that support zone (~1.3450–1.3470), then jumped ~50 pips. The intraday high near 1.3500 is now the immediate hurdle. If GBP breaks above 1.3500 decisively, it could run toward 1.3560. Conversely, a failure to sustain that pop would risk another slide toward 1.3450 (or lower if fiscal fears flare).
- Key Levels – Immediate support is at 1.3450 (monetary support floor). Resistance comes in at 1.3500 (round number/breakout line) and then 1.3550–1.3560 (last pre-crash high).
- Chart Pattern – Recent price action resembles a falling wedge / “V” recovery. Breaking above 1.3500 could confirm a reversal of last week’s downtrend. Watch for a confirmed higher high on hourly/daily charts.
- Indicator Signals – Monday’s sharp rise likely pushed the RSI toward the 60–70 zone. An RSI flattening or MACD convergence around 0.00 would warn of exhaustion. A healthy pullback to ~1.3475 may offer a re-entry if bulls remain in control.
Macro Factors
GBP/USD’s moves have been geopolitically charged. The BoE held rates at 4.0% (dovish versus Fed) and UK fiscal policy fears have “sent Sterling sliding toward 1.34”. Indeed, currency analysts note that oversize UK deficits have spooked traders. Still, if the BoE turns dovish (Pill, Bailey speeches on Monday) while the Fed stays cutting, GBP could find support in the mid-1.34s. For now, the chart focus is technical: Breakout above 1.3500 could target a retest of 1.3550+, but failure would likely drop price back to 1.3450 or lower.
USD/CAD
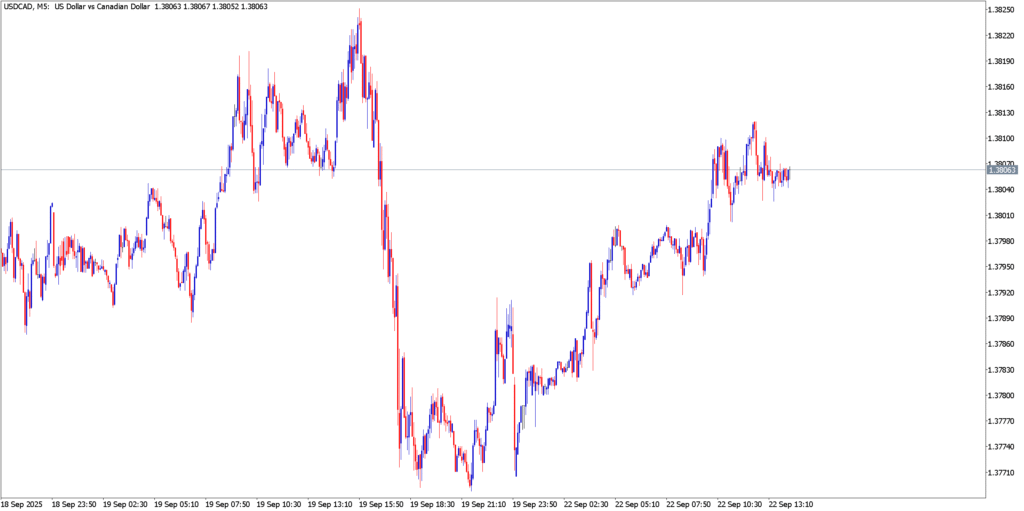
Following last week’s BoC-cut tumble, USD/CAD bounced back aggressively on Monday. A classic trend shift is in play: Monday’s rally reclaimed 1.3780–1.3800 resistance, making the pair look poised for more upside. Support now sits near 1.3720, which was a prior neckline in a possible head‑and‑shoulders (H&S) pattern on daily charts. Monday’s high (~1.3810) narrowly missed the 1.3820 pivot, but a clean break above that mark targets the next zone near 1.3900 (daily chart resistance).
- Pattern & Levels – Technicals hint at an incomplete H&S (USD strength shoulder). A daily close above 1.3820–1.3850 could break the multi-week range and aim for 1.3900–1.4000. On the downside, a decisive drop below 1.3720 (neckline) could trigger a fast slide to 1.3500.
- Moving Averages – The 100-day MA (around 1.3760) has been acting as support. Monday’s push rebounded off that level, suggesting buyers stepped in. If USD/CAD closes below the 100-day MA again, it may signal a resumption of the downtrend.
- Momentum – On the 5min chart, RSI and MACD should be checked: RSI likely rose back to ~50–60. A clear MACD cross above zero would reinforce the bullish case. Conversely, RSI failing to climb above 50 or a bearish MACD cross would hint at a stalling move.
Fundamentals
Both central banks cut rates last week, but the Fed remains far higher (4.25% vs BoC’s 2.50%). Traders note Fed cuts will be more aggressive in 2026, which should favor the Loonie long-term. However, oil prices and trade negotiations still swing USD/CAD on the short-term. For Monday, the technicals hold sway: the pair has shifted into a bullish range breakout mode after holding 1.3720 support. A break over 1.3820 (even just on a 5-min close) could ignite a fresh leg up. If that fails, watch for a quick double-bottom back toward 1.3720.