


The top 20 trading indicators are essential tools for traders to analyze market trends, momentum, volatility, and volume. These indicators, including Moving Averages, RSI, MACD, Bollinger Bands, and OBV, help traders make informed decisions in forex, stocks, and crypto markets, improving the chances of profitable trades.
Key Takeaways
- Trading indicators help analyze trends, momentum, volatility, and volume.
- Combining multiple indicators increases trading accuracy and reduces risk.
- Different indicators suit forex, stock, and crypto markets.
- Understanding indicator purpose is critical before applying them in real trading.
- Effective use involves proper settings, timing, and strategy integration.
What Are Trading Indicators?
Trading indicators are mathematical calculations based on price, volume, or open interest used by traders to analyze market behavior. They help identify trends, momentum, volatility, and potential entry or exit points. Indicators are essential tools for technical analysis, providing actionable insights without relying solely on market intuition.
Using indicators effectively allows traders to make informed decisions, anticipate market movements, and reduce the risks associated with guesswork. They can be applied across various markets, including forex, stocks, and cryptocurrencies, making them versatile for all trading strategies.
Categories of Trading Indicators
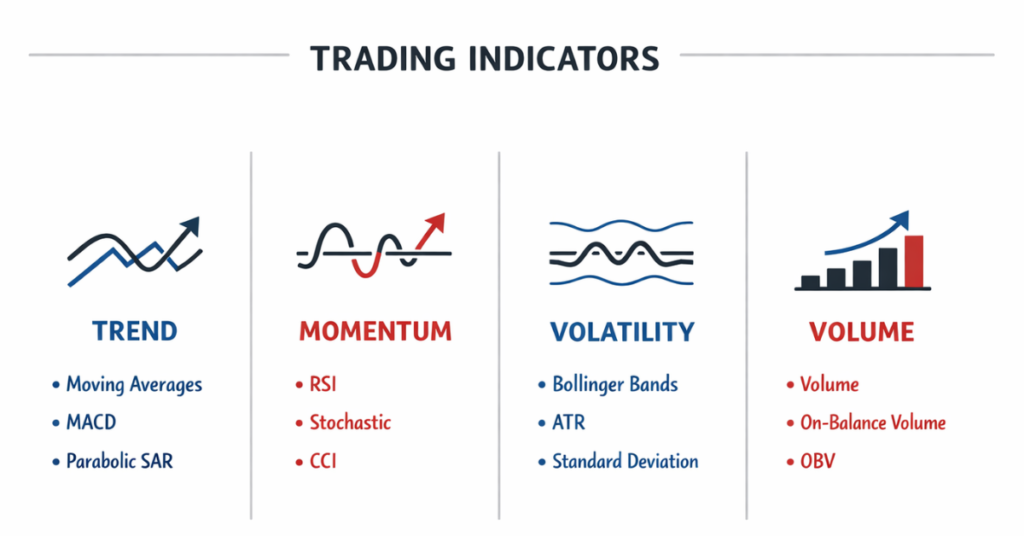
Trading indicators are broadly classified into four main categories, each serving a unique purpose in market analysis:
1. Trend Indicators
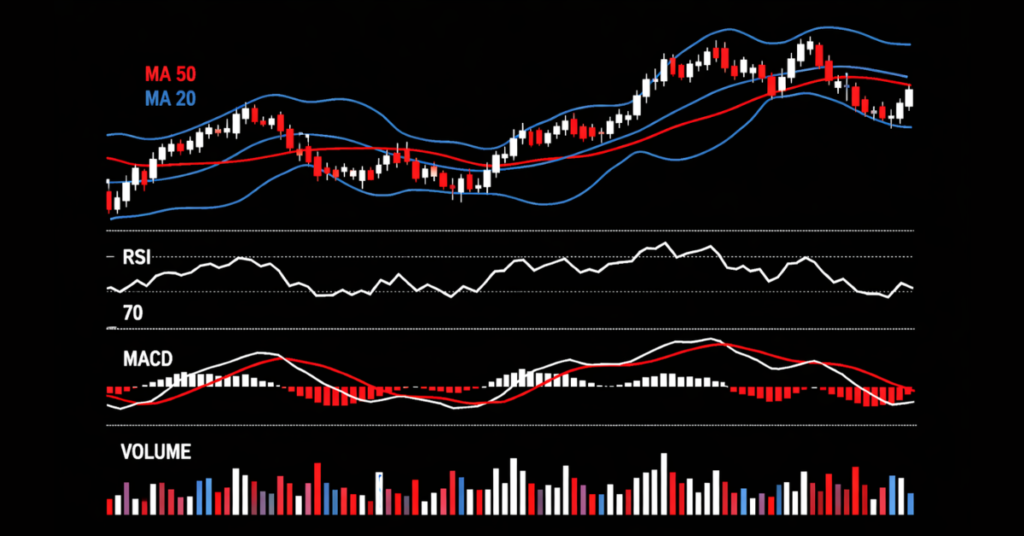
Trend indicators help traders identify the direction of the market and confirm whether an asset is in an uptrend, downtrend, or sideways movement. Popular examples include Moving Averages (MA) and the Moving Average Convergence Divergence (MACD). These indicators are essential for spotting entry and exit points in trending markets.
2. Momentum Indicators
Momentum indicators measure the speed and strength of price movements, helping traders spot overbought or oversold conditions. Key examples are the Relative Strength Index (RSI) and Stochastic Oscillator. These are especially useful for timing trades and understanding potential reversals.
3. Volatility Indicators
Volatility indicators show the degree of price fluctuation over a period, helping traders assess market risk. Common tools include Bollinger Bands and the Average True Range (ATR). High volatility can signal potential breakouts or caution for risk management.
4. Volume Indicators
Volume indicators track the amount of trading activity, confirming trends and the strength of price movements. Examples include On-Balance Volume (OBV) and Volume Oscillator. They are vital for validating trend signals and spotting potential market exhaustion.
Top 20 Trading Indicators (Detailed List)
Here is a comprehensive list of the top 20 trading indicators used by traders across forex, stocks, and crypto markets. Each indicator includes its type, best use, and key benefits.
| Indicator Name | Type | Best For | Key Benefits |
| Moving Averages (MA) | Trend | Identifying trends | Smooths price data to highlight market direction |
| MACD | Trend | Spotting trend changes | Shows momentum and potential reversals |
| Relative Strength Index (RSI) | Momentum | Overbought/oversold conditions | Measures price speed and potential reversal points |
| Stochastic Oscillator | Momentum | Timing entries/exits | Identifies overbought and oversold levels |
| Bollinger Bands | Volatility | Detecting price volatility | Highlights price breakouts and contraction periods |
| Average True Range (ATR) | Volatility | Measuring market volatility | Helps set stop-loss and assess risk |
| On-Balance Volume (OBV) | Volume | Confirming trends | Tracks buying/selling pressure |
| Volume Oscillator | Volume | Trend validation | Measures difference between two volume moving averages |
| Ichimoku Cloud | Trend | Identifying support/resistance | Provides trend direction and momentum signals |
| Parabolic SAR | Trend | Spotting trend reversals | Indicates potential entry/exit points |
| Fibonacci Retracement | Trend | Support/resistance levels | Identifies potential retracement levels |
| Commodity Channel Index (CCI) | Momentum | Overbought/oversold levels | Detects cyclical trends in markets |
| Average Directional Index (ADX) | Trend | Strength of trend | Quantifies trend strength, not direction |
| Chaikin Money Flow (CMF) | Volume | Confirming price movement | Tracks accumulation/distribution |
| Williams %R | Momentum | Reversal signals | Shows overbought/oversold market levels |
| Pivot Points | Trend | Daily support/resistance | Helps predict key price levels |
| Money Flow Index (MFI) | Volume | Momentum + volume | Combines price and volume to detect trend reversals |
| Keltner Channels | Volatility | Trend and breakout detection | Highlights volatility and price channels |
| Donchian Channels | Volatility | Trend identification | Shows recent highs and lows to indicate breakout points |
| Ultimate Oscillator | Momentum | Timing trades | Combines short, medium, long-term momentum to reduce false signals |
How to Use Trading Indicators Effectively
Using trading indicators effectively requires understanding their purpose, combining them strategically, and avoiding over-reliance on a single tool. Here’s how traders can maximize their effectiveness:
1. Combine Multiple Indicators
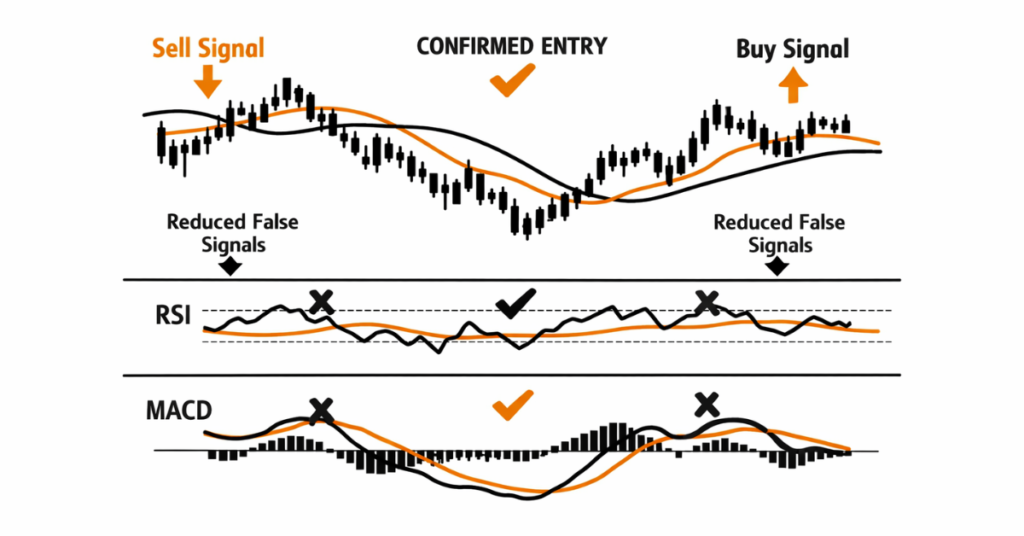
No single indicator can provide a complete market view. Combining trend, momentum, volatility, and volume indicators helps confirm signals and reduces false alerts. For example, using MACD with RSI can validate trend direction and timing for entries or exits.
2. Set Proper Parameters
Adjust indicator settings like periods, timeframes, and sensitivity according to your trading style. Day traders may prefer shorter periods for quick signals, while swing traders benefit from longer periods to identify broader trends.
3. Avoid Indicator Overload
Too many indicators on a chart can create confusion and conflicting signals. Focus on 3–5 complementary indicators to maintain clarity while making informed decisions.
4. Adapt to Market Conditions
Indicators perform differently in trending versus ranging markets. For instance, trend indicators like Moving Averages are more effective in trending markets, while momentum indicators like RSI work better in sideways markets.
Trading Indicators for Different Markets
Trading indicators are versatile, but their effectiveness can vary across different markets. Understanding which indicators work best for forex, stocks, and crypto can help traders tailor their strategies.
1. Forex Markets
In forex, liquidity and volatility are high, making trend and momentum indicators particularly effective. Tools like Moving Averages, MACD, RSI, and Bollinger Bands help identify trend direction, overbought/oversold conditions, and breakout opportunities. Forex traders often combine indicators with currency-specific strategies for better timing.
2. Stock Markets
Stocks often experience longer-term trends with periodic volatility. Indicators such as Moving Averages, MACD, ADX, and Fibonacci Retracement are widely used to identify trend reversals and key support/resistance levels. Volume indicators like OBV are crucial to confirm breakout strength and accumulation/distribution phases.
3. Cryptocurrency Markets
Crypto markets are highly volatile and can experience rapid price swings. Indicators like RSI, Bollinger Bands, ATR, and Keltner Channels are effective for spotting extreme price movements and potential reversals. Traders often combine these with momentum indicators to manage risk and capitalize on short-term opportunities.
Top Indicators for MT5 & Other Platforms
MetaTrader 5 (MT5) is one of the most popular trading platforms, offering advanced charting tools and a wide range of built-in indicators. Traders can use the top 20 trading indicators seamlessly on MT5, including Moving Averages, RSI, MACD, Bollinger Bands, and Fibonacci Retracements.
Using Indicators on MT5:
- MT5 allows traders to customize indicator settings, including periods, colors, and signal alerts.
- Indicators can be combined in multiple chart windows, helping traders monitor different time frames simultaneously.
- MT5 also supports automated trading strategies using indicators through Expert Advisors (EAs), allowing trades to execute based on predefined signals.
4 Common Mistakes When Using Trading Indicators
Even the most powerful indicators can lead to losses if used incorrectly. Here are some common mistakes traders should avoid:
1. Over-reliance on a Single Indicator: Relying solely on one indicator can give misleading signals. Combining trend, momentum, volatility, and volume indicators provides a more accurate market perspective.
2. Ignoring Market Context: Indicators should complement market analysis, not replace it. Failing to consider fundamentals, news events, and overall market conditions can result in poor trades despite clear indicator signals.
3. Overloading Charts: Using too many indicators on a single chart can cause confusion and conflicting signals. Focus on a few complementary tools to maintain clarity and effective decision-making.
4. Not Adjusting Settings: Default settings may not suit all trading styles or markets. Traders should customize parameters such as periods, timeframes, and sensitivity to fit their strategies.
Final Thoughts
The top 20 trading indicators provide traders with a versatile toolkit for analyzing market trends, momentum, volatility, and volume across forex, stocks, and crypto markets. Combining multiple indicators, adjusting settings for your trading style, and applying proper risk management ensures more informed and accurate trading decisions.
For traders looking to apply these indicators in real markets, using a broker like Defcofx can enhance the trading experience:
- High Leverage Options: Trade with up to 1:2000 leverage, allowing greater flexibility in position sizing.
- 40% Welcome Bonus: First-time deposits starting at $1000 qualify for a bonus, giving traders extra capital to experiment with indicators.
- No Commissions or Swap Fees: Low spreads starting from 0.3 pips help maximize profits from indicator-based trades.
- Global Reach: Defcofx is accessible worldwide, with multi-language support, enabling traders from all countries to apply strategies seamlessly.
- Fast Support and Withdrawals: Funds are processed within 4 business hours, including weekends, ensuring timely access to capital for trading opportunities.
Final Thoughts on Top 20 trading indicators
The top 20 trading indicators equip traders with a comprehensive toolkit to analyze trends, momentum, volatility, and volume across forex, stocks, and crypto markets. By combining multiple indicators, customizing settings for specific trading styles, and applying disciplined risk management, traders can make more informed and accurate decisions.
Using a broker like Defcofx further enhances the trading experience, offering up to 1:2000 leverage for greater flexibility, a 40% welcome bonus on first-time deposits of $1000 or more, and low spreads from 0.3 pips with no commissions or swap fees.
With global accessibility, multi-language support, and fast withdrawals within 4 business hours including weekends, traders can confidently apply their indicator strategies in real market conditions, maximizing opportunities while maintaining efficiency and control.
Open a Live Trading AccountFAQs
For beginners, simple indicators like Moving Averages (MA) and Relative Strength Index (RSI) are ideal. They help identify trends and overbought/oversold conditions without overwhelming new traders.
Using 3–5 complementary indicators is recommended. Combining trend, momentum, and volume indicators provides a balanced view without cluttering charts or creating conflicting signals.
No, indicators cannot predict exact prices. They are tools for analyzing market trends and probabilities, helping traders make informed decisions while managing risk.
Most indicators like MA, RSI, MACD, Bollinger Bands, and OBV are free and available on platforms like MetaTrader 5 (MT5). Some advanced or custom indicators may be paid or subscription-based.
Yes, Defcofx supports all major indicators on platforms like MT5, enabling traders to apply strategies with high leverage, low spreads, and fast withdrawals, enhancing the overall trading experience.