


In trading, long lower wicks on candlesticks are often seen as a buy signal. They show that prices were pushed down, but buyers stepped in and drove the price back up. This type of wick can signal bullish pressure, but only when confirmed by trend, support, or indicators.
Key Takeaways
- Candlestick wicks show where price has moved during a candle but failed to stay.
- A long lower wick often signals buying interest and a bullish reversal.
- A long upper wick shows selling pressure and possible bearish reversal.
- Lower wick buys must be confirmed by trend direction, support zones, or indicators.
- Wick signals vary by timeframe; always assess the full chart context.
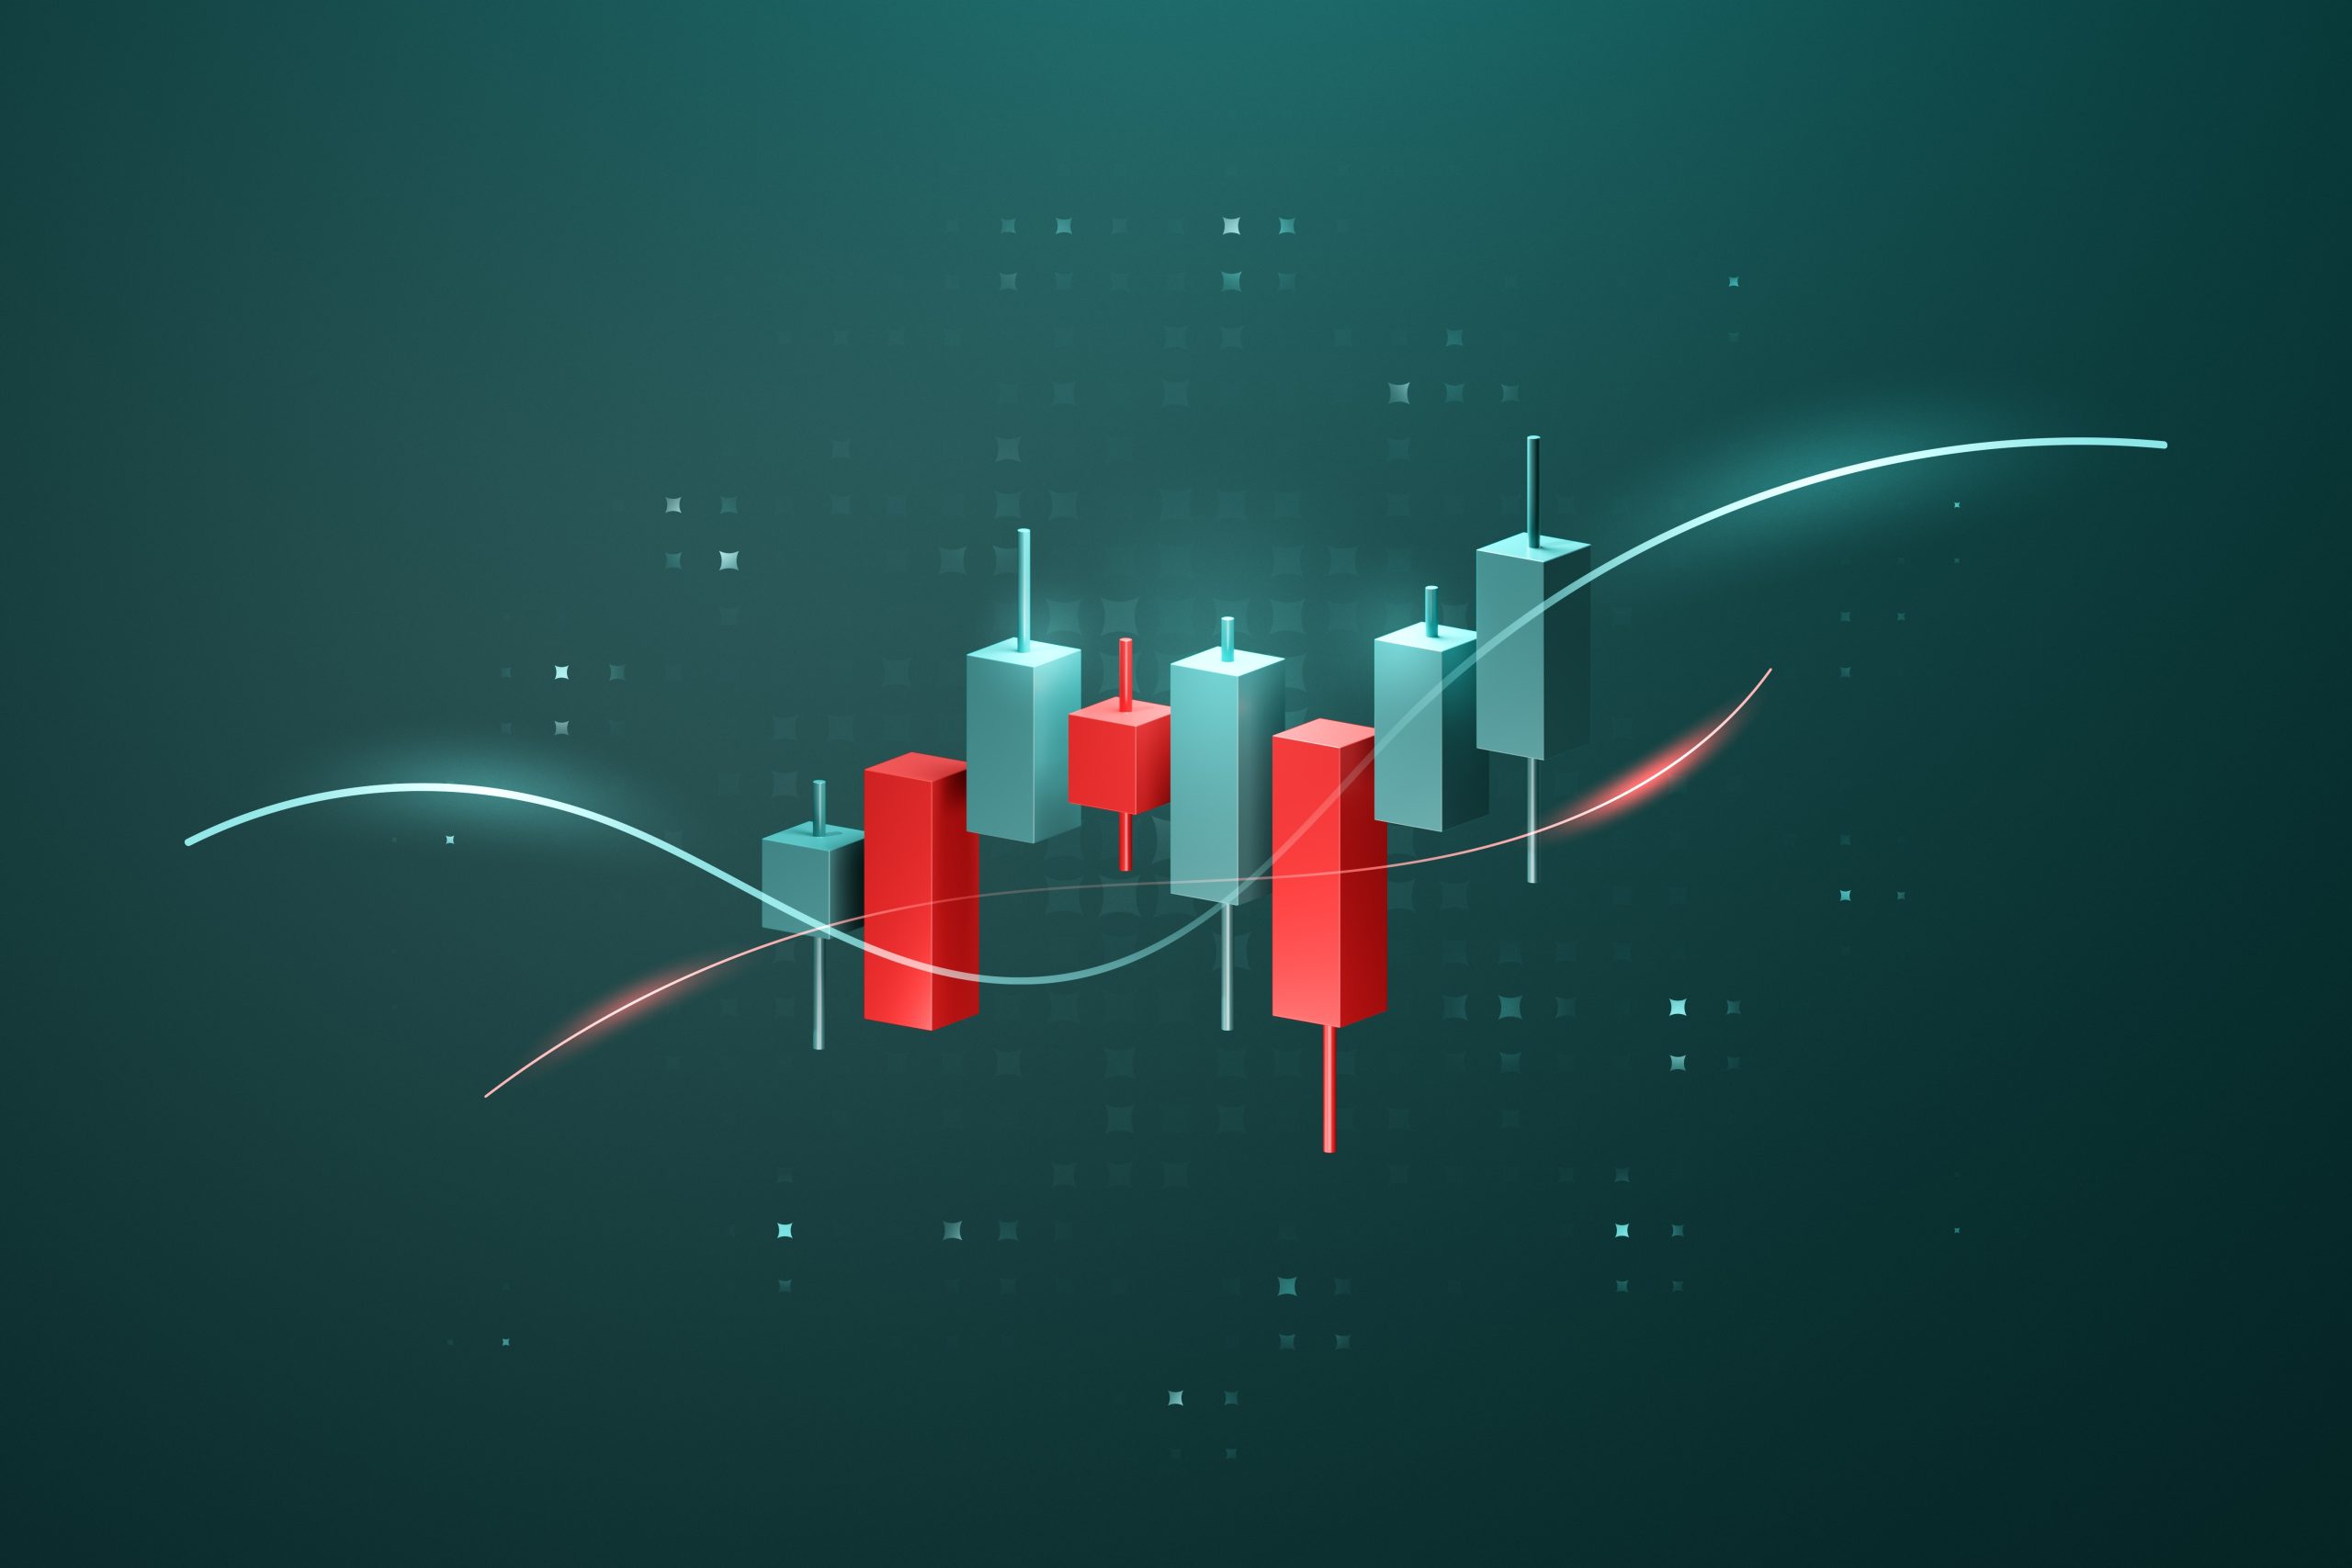
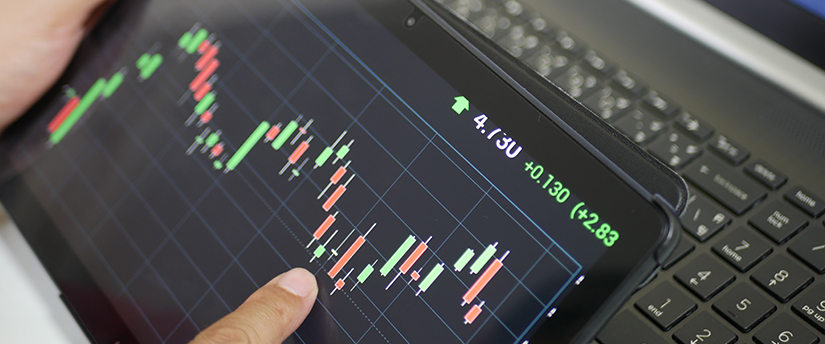
What Are Candlestick Wicks in Trading?
On a candlestick chart, each candle has a body and possibly wicks (also called shadows). The body shows where the price opened and closed. The wicks show the highest and lowest points reached during that candle’s time period.
- Upper Wick: The line above the candle body, showing how high the price went before falling.
- Lower Wick: The line below the candle body, showing how low the price went before rising.
Why Long Lower Wicks Signal Buying Pressure
A long lower wick means sellers pushed the price down, but buyers came in strong and drove the price back up. This often signals bullish rejection, which is when the market refuses to stay low.
This is seen as a potential buy signal because it shows that buyers are active near that level. The longer the lower wick, the stronger the buying pressure, especially if the candle closes with a small body near the top.
When Is This Most Powerful?
- Near a support level
- After a downtrend
- On higher timeframes (1H, 4H, Daily)
- With confirmation from RSI, MACD, or trendlines
Difference Between Upper Wick and Lower Wick
| Wick Type | Meaning | Signal Type | Ideal Action |
| Lower Wick | The price dropped, but buyers pushed it back | Bullish (Buy) | Look for entries |
| Upper Wick | Price rose, but sellers pushed it back | Bearish (Sell) | Watch for exits |
Which Wick Is Buys in Trading?
So, which wick is buys in trading?
The answer is long lower wicks.
These lower shadows suggest that even though the market dipped, buyers came in strong and pushed the price higher. It’s a sign that demand is greater than supply at that price level, which often leads to upward movement.
However, traders shouldn’t buy based on the wick alone. It’s important to combine wick analysis with:
- Overall trend direction.
- Support and resistance zones.
- Technical indicators (like RSI and moving averages).
- Price action confirmation.
Mini Strategy: How to Trade a Buyable Wick
Here’s a simple step-by-step guide to trading a bullish lower wick:
- Spot the Wick: Find a candle with a long lower wick and small upper body.
- Check the Trend: Is the market in an uptrend or bouncing off support?
- Use Confirmation: Wait for the next candle to close above the wick body or use RSI/Stochastic for entry confirmation.
- Enter Trade: Buy once confirmation occurs. Place a stop-loss below the wick’s lowest point.
- Set Target: Use previous resistance or a risk-to-reward ratio like 1:2.
Real-World Examples of Wick Buying
Forex
On the EUR/USD 1-hour chart:After a downtrend, a candle forms with a 40-pip lower wick near a support level. The next candle closes bullish. Price bounces upward 80 pips.
Stocks
On a daily chart of Apple (AAPL): A long lower wick forms during market panic. Volume spikes. The next day, the price gaps up, confirming buyer interest.
Crypto
On Bitcoin’s 15-minute chart: During a volatile dip, a candle prints a large lower wick at $29,800 and closes near $30,500. Buyers rushed in, and the price continued to rally.
In all cases, the wick itself gave a clue, but confirmation made the setup tradable.
4 Risks of Trading Based on Wicks
While wicks can show powerful reversal signs, there are risks to keep in mind:
- False Signals: Not every wick leads to a reversal. Some are just noise or random volatility.
- Wick Traps: During news events, large wicks form as stop-hunts or manipulation, especially in forex and crypto.
- No Confirmation: Buying without waiting for confirmation can lead to early entries and losses.
- Different Timeframes, Different Stories: A wick on the 1-minute chart may not even exist on the 1-hour chart. Always match your strategy to the timeframe.
Risk management is key. Use stop-losses and avoid chasing every wick you see.
How Wick Behavior Changes Across Timeframes
Wicks appear differently depending on the chart timeframe.
- 1-Minute or 5-Minute: Many false wicks, high noise, low reliability
- 15-Minute to 1-Hour: Better wick patterns, used by day traders
- 4-Hour and Daily: Most reliable wick signals, used by swing traders and institutions
For most beginners, the 1-hour or 4-hour timeframe offers a good balance between signal quality and trading opportunities.
Looking to trade raw candlestick signals with real-time spreads and no hidden fees?
Join Defcofx Today.Final Thoughts: Which Wick is a Buy in Trading
Understanding which wick is bought in trading helps you spot early signs of bullish reversal and market strength. Long lower wicks suggest buyers stepped in after a price dip, showing demand and potential for a bounce. But successful trading comes from combining wick analysis with broader price action, support/resistance levels, and proper confirmation.
At Defcofx, traders can apply wick strategies with tight raw spreads, no swap fees, and lightning-fast execution, creating the perfect environment for precision entries and confident decision-making. Whether you trade forex, crypto, or indices, the right wick can make all the difference.
Want to trade with real price action tools and no distractions?
Start Trading with DefcofxFAQs
A long lower wick often signals a buying opportunity. It means that sellers pushed prices down, but buyers stepped in and forced the price back up before the candle closed. This indicates bullish rejection and potential reversal, especially when seen at support zones or after a downtrend.
To confirm a lower wick buy signal, wait for the next candle to close above the wick’s body, or use an indicator like RSI to detect oversold conditions. Also, check if the wick forms near a support level or within a bullish trend. Confirmation avoids false entries.
No. Wick signals are more reliable on higher timeframes like the 1-hour, 4-hour, or daily chart. On smaller charts like the 1-minute or 5-minute, wicks often appear due to market noise, spread variation, or stop-hunting. Always match wick strategies to appropriate timeframes.
Yes, wick analysis works in stocks, crypto, commodities, and even indices. The concept of price rejection is universal. Just make sure to combine it with confirmation and risk management, regardless of the asset. The candle’s context and the market’s behavior still matter.
Don’t enter a trade just because you see a long wick. Always look for confirmation like trend direction, support/resistance, or indicator alignment. Avoid trading wicks during news events, and don’t use them in isolation. Risk management is essential to avoid getting trapped by fake signals.
Defcofx Forex Articles You Shouldn’t Miss
Discover powerful forex strategies in these top reads from Defcofx.