


SMT in trading stands for Smart Money Technique. It refers to a concept where traders compare price movements between correlated markets to identify divergence, signaling potential institutional activity and possible trend reversals or continuations based on smart money behavior rather than indicators alone.
Key Takeaways
- SMT (Smart Money Technique) helps traders spot potential market reversals or continuations by comparing price behavior between correlated assets.
- SMT divergence occurs when one market makes a higher high or lower low while the related market fails to do so.
- SMT is widely used in forex and ICT-style trading to confirm directional bias rather than to generate standalone entries.
- It works best when combined with market structure, liquidity, and risk management, not in isolation.
- SMT focuses on institutional behavior, making it more context-driven than traditional indicator-based divergence.
What Is SMT in Trading?
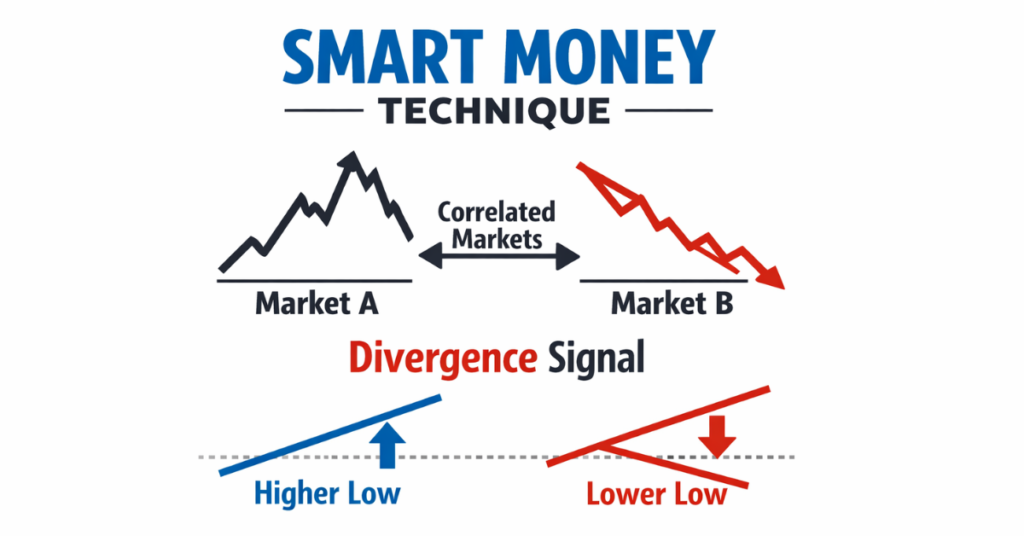
SMT (Smart Money Technique) is a trading concept based on the idea that institutional traders, often called smart money, leave signals in price movement when they are accumulating or distributing positions. Instead of analyzing one chart alone, SMT requires traders to compare two or more correlated markets to spot divergence or imbalance.
SMT works on a simple idea: correlated assets should usually move in the same direction. When one market makes a new high or low but the other market doesn’t confirm it, this can signal weakness in the move. Traders often treat this divergence as a warning that the trend may be losing strength and could reverse.
SMT is a price-action-based approach. It does not rely on indicators such as oscillators or lagging tools. Instead, it focuses on how price behaves across related markets to identify possible liquidity grabs and shifts in institutional activity.
SMT isn’t designed to give exact entry points. Its main purpose is to provide directional bias and market context, helping traders make better decisions based on how smart money may be positioned.
What Is SMT Divergence?
SMT divergence occurs when two correlated markets move out of sync, revealing potential smart money activity. In simple terms, it happens when one market makes a higher high or lower low, while the related market fails to confirm that move. This imbalance often signals weakening momentum or a possible shift in institutional direction.
Unlike traditional divergence, which compares price with indicators like RSI or MACD, SMT divergence is based entirely on price comparison between markets. This makes it more aligned with how professional traders analyze liquidity and relative strength.
For example, if EUR/USD makes a new high while GBP/USD fails to do so, traders may interpret this as a bearish SMT divergence.
This lack of confirmation suggests institutional buying pressure may be weakening, which can increase the probability of a reversal or consolidation.
SMT divergence doesn’t guarantee a trade outcome. Instead, it acts as a contextual confirmation tool, helping traders avoid chasing moves that may be driven by short-term liquidity grabs rather than genuine market strength.
How SMT Divergence Works in Trading
SMT divergence works by tracking relative price behavior across correlated markets to identify potential institutional activity. Instead of relying on traditional indicators, traders observe how one market moves in relation to another to detect inefficiencies, liquidity imbalances, and hidden market pressure.
Here’s how it generally operates:
- Identify correlated markets: Traders select two or more assets that typically move together, such as currency pairs like EUR/USD and GBP/USD, or related commodities and indices.
- Observe price behavior: When one market makes a higher high or lower low while the other fails to confirm, it signals a divergence in activity.
- Interpret the divergence: A lack of confirmation suggests institutional players may be accumulating or distributing positions, potentially leading to reversals or trend continuation.
- Confirm with market structure: Traders combine SMT signals with support/resistance levels, liquidity zones, and market trends to validate their strategy.
Why it matters: SMT divergence provides insight into the behavior of smart money, helping traders align with professional flows rather than relying on lagging indicators.
Types of SMT Divergence
SMT divergence can be classified into two main types, depending on the direction of the potential market shift:
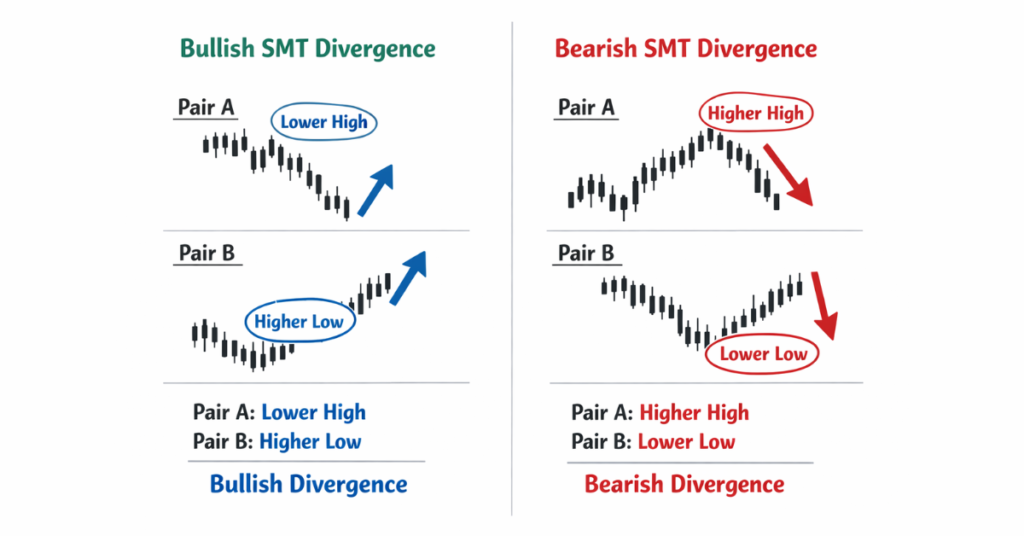
1. Bullish SMT Divergence
Occurs when the primary market makes a lower low while the correlated market fails to follow and instead shows a higher low or remains stable. This suggests that selling pressure is weakening and smart money may be accumulating positions, signaling a possible upward reversal.
2. Bearish SMT Divergence
Happens when the primary market makes a higher high but the correlated market does not confirm with a corresponding high. This indicates that buying momentum is fading, and institutional traders may be distributing positions, signaling a potential downward reversal.
Both types aren’t exact trade signals, but rather confirmation tools to detect where smart money might be influencing the market. Successful traders often combine SMT divergence with market structure, liquidity zones, and risk management strategies to increase accuracy.
SMT in Forex Trading
In forex markets, SMT (Smart Money Technique) is widely applied because currency pairs often move in correlated patterns. Traders compare the price action of major pairs, such as EUR/USD vs GBP/USD or USD/JPY vs AUD/USD, to spot divergences that indicate potential institutional activity.
For example, if EUR/USD makes a higher high while GBP/USD fails to match that movement, this could indicate a bearish SMT divergence, signaling that buying momentum is weakening in the primary pair.
Conversely, if one pair shows strength while the other lags, it may reveal hidden accumulation by smart money, offering traders clues about future trend direction.
SMT in forex is particularly valuable because the market is highly liquid and influenced heavily by institutional flows. By identifying divergences early, traders can:
- Align trades with the likely direction of institutional positioning
- Avoid false breakouts and short-term liquidity grabs
- Improve risk management by confirming entries with divergence patterns
SMT in ICT (Inner Circle Trader) Trading
In ICT (Inner Circle Trader) methodology, SMT is a core tool for confirming market bias. ICT traders use SMT divergence to identify where smart money (institutions) is likely positioning themselves. By comparing correlated markets, SMT signals help traders confirm directional bias before entering trades, reducing reliance on lagging indicators.
For example, in ICT strategies, if EUR/USD fails to confirm a new high that GBP/USD has made, traders interpret this as a bearish SMT divergence.
This divergence can help traders align their trades with institutional order flow, which may improve the probability of a higher-quality setup.
Integration with Trading Platforms: Platforms like Defcofx provide features that enhance SMT application:
- High Leverage Options: Up to 1:2000 leverage allows traders to maximize opportunities once SMT divergence is identified.
- No Commissions or Swap Fees: Tight spreads starting from 0.3 pips make trading multiple correlated pairs cost-effective.
- Fast Support and Withdrawals: Traders can quickly adjust positions or access funds within 4 business hours, ensuring smooth execution.
How to Identify SMT Divergence Step by Step
Identifying SMT divergence requires a structured approach to ensure traders accurately detect potential smart money activity. Here’s a step-by-step guide:
Step 1: Select Correlated Markets
Choose two or more assets that usually move together, such as EUR/USD vs GBP/USD, or commodities and related indices. Strong correlations provide more reliable divergence signals.
Step 2: Analyze Price Action
Observe the highs and lows of each market. A divergence occurs when one market makes a new high or low while the other fails to follow. This indicates potential institutional accumulation or distribution.
Step 3: Confirm Trend Context
Check the larger market structure. Ensure the divergence aligns with the overall trend and key support/resistance levels to avoid false signals.
Step 4: Validate with Timeframes
Compare divergence signals across multiple timeframes. A signal confirmed on higher timeframes (e.g., H4 or Daily) carries more weight than one only visible on smaller timeframes.
Step 5: Use Risk Management
Even with SMT confirmation, always define entry, stop-loss, and take-profit levels. Divergence indicates potential movement but does not guarantee results.
Best Timeframes for SMT Trading
SMT divergence can work on many timeframes, but the timeframe you choose affects reliability and speed. In general:
- Higher timeframes give stronger and cleaner signals
- Lower timeframes give faster but noisier signals
Timeframe Guide (Beginner-Friendly Table)
| Timeframe Type | Timeframes | Best For | Why It Works | Beginner Rating |
|---|---|---|---|---|
| Higher Timeframes | H4, Daily, Weekly | Swing trading and long-term moves | Less market noise, stronger institutional activity, clearer highs/lows | Best choice |
| Lower Timeframes | M15, M30, H1 | Day trading and scalping | More setups and quicker entries, but more false signals | Medium |
| Multi-Timeframe Approach | Higher + Lower combined | Traders who want both accuracy and good entries | Higher timeframe gives direction, lower timeframe helps entry timing | Best method |
What These Timeframes Mean (Quick Explanation)
- M15 = 15-minute chart
- M30 = 30-minute chart
- H1 = 1-hour chart
- H4 = 4-hour chart
- Daily = 1-day chart
- Weekly = 1-week chart
What “Market Noise” Means
Market noise refers to random price movement that happens because of:
- Short-term traders entering and exiting quickly
- News spikes and volatility
- Low liquidity periods
This noise can create false SMT signals, especially on smaller timeframes.
Recommended Approach (Simple Multi-Timeframe Strategy)
A beginner-friendly SMT process:
- Find SMT Divergence on H4 or Daily: This gives you the main direction (bullish or bearish bias).
- Drop to M30 or H1 for entry timing: Look for confirmation such as structure break, liquidity sweep, or a clean entry model.
- Use M15 only for precise entry (optional): This is helpful but not required.
Example: If you spot bullish SMT divergence on H4, then monitor M30 for an entry setup aligned with that bullish direction.
SMT Trading Strategy Example
Below is a practical example of how to apply SMT divergence in a real trading setup.
Step 1: Select Correlated Markets
Choose two correlated pairs that often move together, such as:
- EUR/USD
- GBP/USD
Note: Pick one pair as the Primary Pair (the pair you plan to trade). The other pair is the Correlated Pair (used for confirmation).
Step 2: Spot SMT Divergence
Look for a mismatch in highs or lows:
- The Primary Pair makes a higher high
- The Correlated Pair fails to make a higher high
This forms a Bearish SMT Divergence, which suggests momentum may be weakening and price could shift into consolidation or reversal.
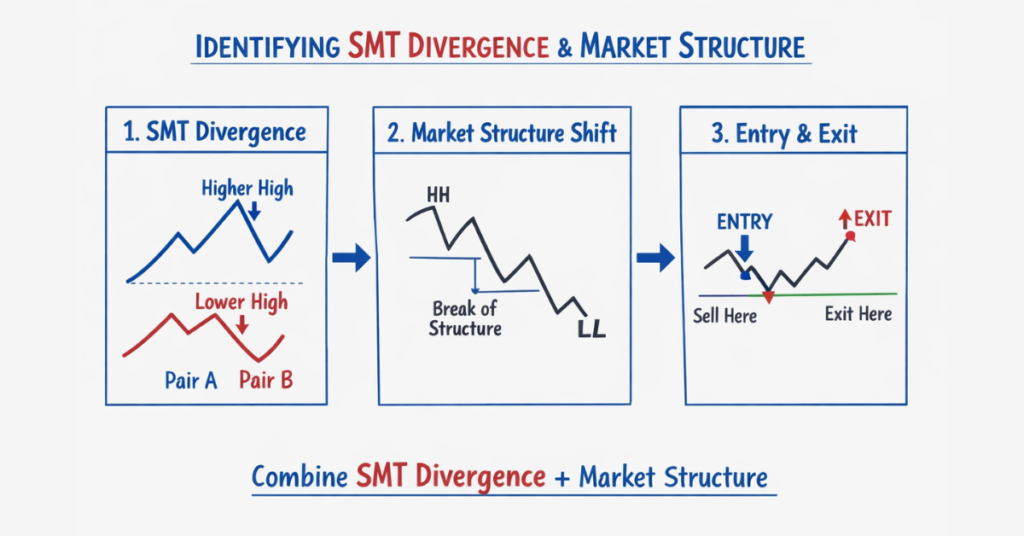
Step 3: Confirm With Market Structure
Before entering any trade, confirm the divergence fits the overall context:
- Identify key Support and Resistance levels
- Mark nearby Liquidity Zones (previous highs/lows)
- Check if price is at a logical turning point (premium/discount zone if using ICT)
- Make sure the setup matches the higher timeframe direction
Step 4: Entry And Risk Management
SMT gives direction, but you still need a clean entry trigger.
A simple execution plan:
- Entry Trigger: Enter after a clear break of structure or bearish confirmation candle
- Stop-Loss: Place above the most recent swing high
- Take-Profit: Target the next key support or liquidity zone
- Risk Rule: Risk only 1% to 2% of your account per trade
Step 5: Add Confirmation (Optional)
To improve accuracy, traders may combine SMT with:
- Market structure breaks (BOS / CHoCH)
- Order blocks
- Fair value gaps (FVG)
- Volume confirmation
- Other ICT concepts
Pro Tip for Defcofx Users:
- Using high leverage options (up to 1:2000) can amplify gains when SMT divergence aligns with market structure.
- Low spreads (from 0.3 pips) reduce costs when trading correlated pairs simultaneously.
Is SMT Divergence Reliable?
SMT divergence is a powerful tool for understanding potential institutional activity, but it is not foolproof. Its reliability depends on context, confirmation, and proper risk management.
Strengths:
- Highlights hidden market imbalances that traditional indicators may miss.
- Helps traders align with smart money, improving trade bias accuracy.
- Works well when combined with market structure, liquidity zones, and higher timeframe analysis.
Limitations:
- Divergence can appear multiple times without triggering significant moves.
- False signals may occur in highly volatile or low-liquidity markets.
- Requires proper selection of correlated markets and timeframe analysis.
Best Practices for Reliability:
- Always confirm divergence with support/resistance and market context.
- Avoid using SMT as a standalone entry signal; treat it as a directional confirmation tool.
- Cross-check on higher timeframes to filter out noise from smaller intraday moves.
SMT vs Regular Divergence
SMT divergence and regular divergence are both used to identify potential weakness in price movement, but they work in different ways. The table below highlights the key differences.
| Feature | Regular Divergence | SMT Divergence |
|---|---|---|
| Basis of comparison | Compares price with an indicator (e.g., RSI, MACD) to spot momentum shifts | Compares price action between two or more correlated markets (e.g., EUR/USD vs GBP/USD) to detect imbalance |
| What it measures | Indicator momentum and potential trend exhaustion | Relative market strength and possible institutional-driven liquidity behavior |
| Main focus | Momentum-based signals | Market structure confirmation and directional bias |
| Typical tools used | RSI, MACD, Stochastic | Correlated pairs, highs/lows, market structure (price action) |
| Reliability | Can give false signals in strong trends or high volatility | Often more context-based, but still not guaranteed and depends on correct pair selection and market conditions |
| Best use case | Finding possible reversals or pullbacks using momentum | Confirming trend bias and identifying potential divergence between correlated markets |
| Common markets | Forex, stocks, crypto | Mostly forex (especially correlated pairs), ICT and institutional-style frameworks |
| Entry signal? | Can be used as an entry trigger in some strategies | Not a standalone entry signal; used as confirmation before executing a setup |
SMT divergence doesn’t guarantee a reversal. It only signals that correlated markets are not confirming each other, which may indicate weakening momentum or liquidity manipulation. Traders usually combine SMT with additional confirmation such as structure breaks, liquidity sweeps, or entry models.
5 Common Mistakes Traders Make With SMT
SMT (Smart Money Technique) can be a powerful tool, but many traders reduce its effectiveness by using it incorrectly. Below are the most common mistakes and how to avoid them.
1) Ignoring Market Context
Relying only on SMT divergence without checking the bigger picture can lead to false signals.
SMT should always be aligned with:
- Market structure (trend direction)
- Key support and resistance levels
- Liquidity zones (previous highs and lows)
2) Overtrading SMT Signals
Some traders try to trade every small divergence, especially on lower timeframes.
This often leads to:
- More losses from weak setups
- Higher transaction costs (spreads and fees)
- Emotional trading and revenge trades
3) Using The Wrong Correlated Markets
SMT works best when comparing markets that are strongly correlated.
A common mistake is comparing:
- Unrelated pairs
- Weakly correlated instruments
This can create misleading divergence and a false SMT signal.
4) Entering Without Confirmation
SMT gives bias, not an automatic entry.
Many traders lose because they enter too early without confirmation such as:
- Break of structure
- Support or resistance reaction
- Higher timeframe alignment
- Order blocks or ICT concepts (optional)
5) Poor Risk Management
Even if SMT is correct, poor risk management can still destroy the trade.
Common risk mistakes include:
- No stop-loss placement
- Stop-loss placed too tight without logic
- Overleveraging
- Risking too much per trade
A safer rule for beginners:
- Risk only 1% to 2% per trade
Final Thoughts on What does SMT mean in Trading
SMT (Smart Money Technique) is a powerful tool for understanding institutional market behavior. By analyzing divergences between correlated markets, traders can gain insights into potential reversals or trend continuations that traditional indicators might miss.
However, SMT isn’t a standalone solution. Its effectiveness depends on proper market context, multi-timeframe confirmation, and risk management. When used as part of a complete trading system, SMT can enhance decision-making, improve trade alignment with smart money, and reduce exposure to false signals.
For traders looking to implement SMT strategies effectively:
- Focus on correlated market analysis
- Confirm signals with market structure and liquidity zones
- Practice disciplined risk management
FAQ’s
SMT stands for Smart Money Technique. In forex, it involves comparing price action between correlated currency pairs to detect divergences that may indicate institutional positioning and potential trend reversals.
While SMT can be powerful, it requires understanding of market structure, correlations, and confirmation techniques. Beginners can use it to gain insight but should combine it with simpler strategies until they gain experience.
Yes. SMT works across any correlated markets, including cryptocurrencies, commodities, and indices, as long as correlations are strong and reliable.
SMT primarily relies on price action, not traditional indicators. However, traders often combine it with support/resistance, order blocks, and liquidity zones to validate signals.
Confirm divergence across higher timeframes
Validate with market structure and liquidity zones
Avoid unrelated or weakly correlated markets
Manage risk with proper stop-loss and position sizing
Defcofx Forex Articles You Shouldn’t Miss
Discover powerful forex strategies in these top reads from Defcofx.
- Intrinsic Value of a Stock: Definition & Calculation
- What is the Big 5 Currency?
- What Is the 3 Strongest Currency?
- What is a Good Profit Factor in Trading?
- How to Start Investing in the Stock Market
- What Is Backtesting in Trading?
- Top 10 Currencies in the World
- What is a Good Profit Factor in Trading?
- What Is a Trade Assist?
- What Are the Golden Rules of Trading?