


MACD (Moving Average Convergence Divergence) is a momentum indicator that shows the relationship between two moving averages of price. The most practical MACD trading strategies include the signal line crossover, zero-line crossover, MACD divergence, and MACD with trend confirmation. Each strategy works differently depending on the timeframe and market conditions.
Key Takeaways
- MACD uses three components: the MACD line, the signal line, and the histogram.
- The default settings are 12, 26, 9 but can be adjusted for different trading styles.
- Signal line crossovers are the most basic MACD strategy.
- MACD divergence is one of the most reliable setups for catching reversals.
- MACD works best when combined with trend direction or price action confirmation.
- Using MACD alone on low timeframes increases false signal risk.
What is MACD and How Does It Work?
MACD stands for Moving Average Convergence Divergence. It was developed by Gerald Appel in the late 1970s. The indicator measures the difference between two exponential moving averages (EMAs) and plots that difference as a line.
The three components of MACD are:
| Component | Calculation | Purpose |
| MACD Line | 12-period EMA minus 26-period EMA | Shows momentum direction and strength |
| Signal Line | 9-period EMA of the MACD line | Smooths the MACD line for crossover signals |
| Histogram | MACD line minus Signal line | Visualizes the distance between the two lines |
When the MACD line is above zero, it means the short-term EMA is higher than the long-term EMA, indicating bullish momentum. When it’s below zero, bearish momentum dominates.
The histogram makes it easy to see when momentum is accelerating or fading. Growing bars signal increasing momentum. Shrinking bars signal that momentum is losing steam.
Default MACD Settings and When to Adjust Them
The standard settings are 12, 26, 9. These work well on daily charts and are widely followed by institutional traders, which means the signals they generate are taken seriously by many market participants.
| Trading Style | Suggested MACD Settings | Best Timeframe |
| Day Trading | 5, 13, 1 or 3, 10, 16 | M5, M15, H1 |
| Swing Trading | 12, 26, 9 (default) | H4, Daily |
| Position Trading | 24, 52, 9 | Weekly, Daily |
| Scalping | 3, 10, 16 | M1, M5 |
MACD Trading Strategy 1: Signal Line Crossover
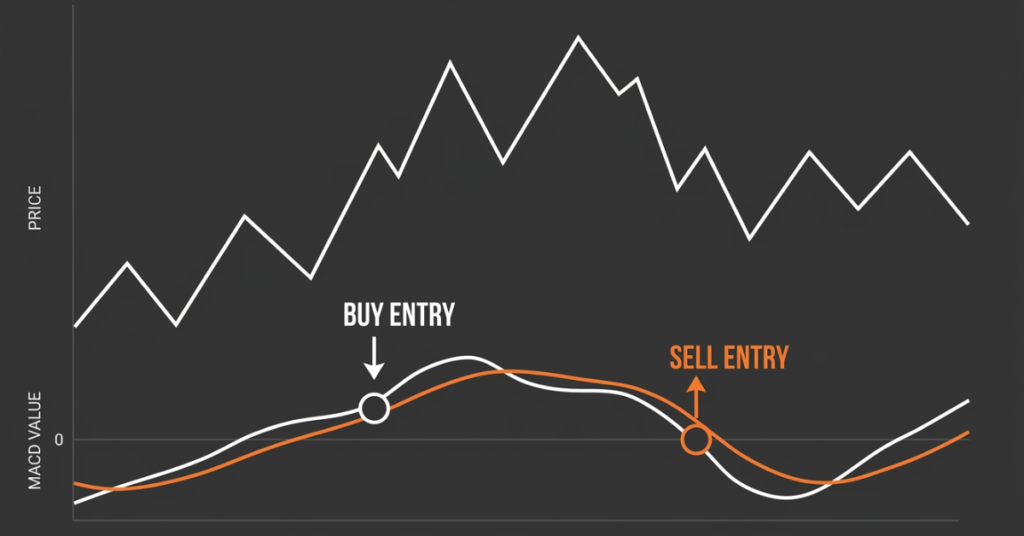
This is the most basic MACD strategy and the one most beginners start with. When the MACD line crosses above the signal line, it generates a buy signal. When it crosses below, it generates a sell signal.
Entry Rules
- Buy when the MACD line crosses above the signal line, preferably while both are below zero (early-stage upward momentum)
- Sell when the MACD line crosses below the signal line, preferably while both are above zero (early-stage downward momentum)
- Look for the crossover to happen away from the zero line for stronger conviction
Why It Works
The crossover happens when short-term momentum shifts relative to the signal average. A cross below the zero line catching a new uptrend is statistically more reliable than a cross that’s been oscillating around zero for a while.
Common Mistake
Taking every signal line crossover on low timeframes leads to overtrading and losses. The signal is most reliable on H4 and daily charts, where market noise is filtered out.
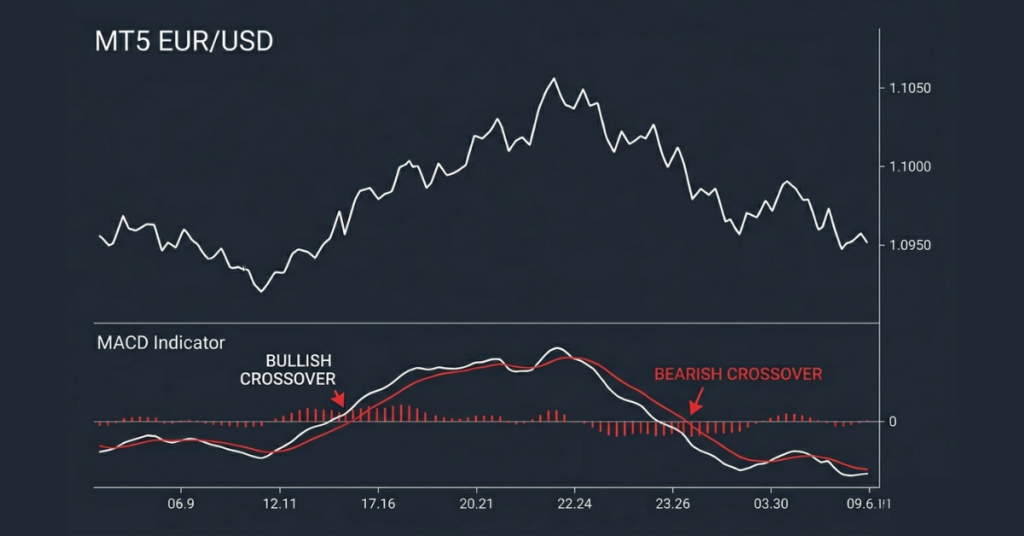
MACD Trading Strategy 2: Zero-Line Crossover
The zero-line crossover happens when the MACD line itself crosses above or below the zero level. This is a slower but more reliable signal than the signal line crossover.
When the MACD line crosses above zero, both the 12 EMA and 26 EMA have now confirmed that shorter-term momentum has overtaken longer-term momentum. It’s a medium-term bullish confirmation.
Entry Rules
- Buy when the MACD line crosses above zero from below
- Sell when the MACD line crosses below zero from above
- Look for the move to happen with clear price action backing it up, such as a break of a key resistance level
Best Use Cases
Zero-line crossovers work best for catching the beginning of a new trend after a period of consolidation or reversal. They are often used by swing traders and position traders who want confirmation before entering a trend.
MACD Trading Strategy 3: MACD Divergence
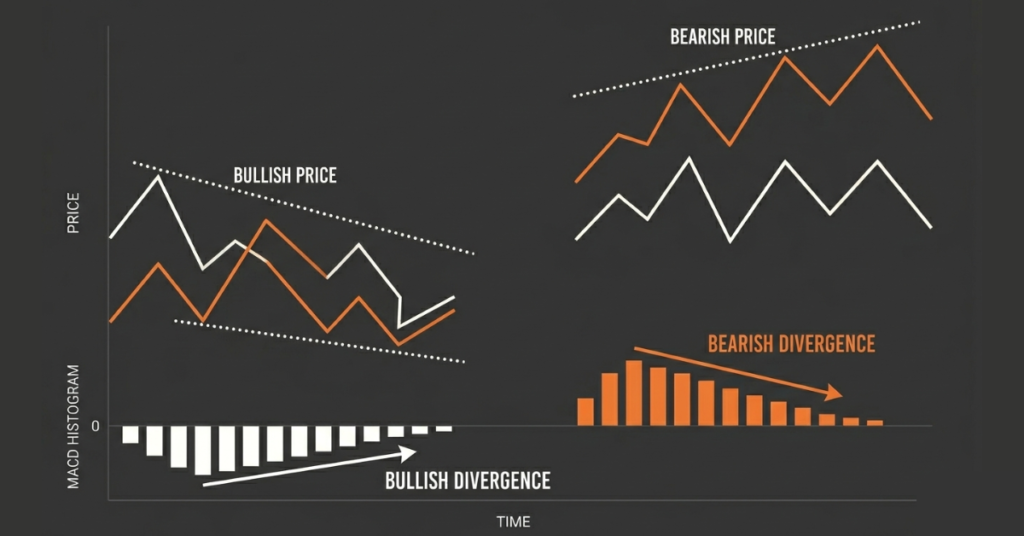
Divergence is when price and the MACD indicator move in opposite directions. It’s one of the most powerful signals MACD can give, and it’s used to spot potential reversals early.
Bullish Divergence
Price makes a lower low, but MACD makes a higher low. This suggests that while price is still falling, downward momentum is weakening. It can signal a coming bullish reversal.
Bearish Divergence
Price makes a higher high, but MACD makes a lower high. This indicates that while price is still rising, upward momentum is fading. It often precedes a pullback or trend reversal.
Hidden Divergence (Trend Continuation)
Hidden bullish divergence: Price makes a higher low, MACD makes a lower low. This signals the trend is likely to continue upward. Hidden bearish divergence: Price makes a lower high, MACD makes a higher high. The trend likely continues downward.
How to Trade MACD Divergence – Step by Step
- Identify a trend on the daily or H4 chart
- Look for divergence between MACD highs/lows and price highs/lows
- Wait for price action confirmation: reversal candle, trendline break, or key level rejection
- Enter the trade in the direction of the divergence signal
- Place stop-loss beyond the recent swing high or low
- Target the next significant support or resistance level
MACD Trading Strategy 4: MACD with Moving Average Trend Filter
This is a more complete strategy that combines MACD signals with a trend filter. The idea is simple: only trade in the direction of the prevailing trend, using MACD to time entries.
Setup
- Use the 200 EMA on the daily chart to identify the overall trend direction
- Drop to the H4 or H1 chart for MACD entries
- Only take bullish MACD signals when price is above the 200 EMA on the daily
- Only take bearish MACD signals when price is below the 200 EMA on the daily
Entry Trigger
Wait for the MACD signal line crossover on H4, combined with a bullish or bearish candle closing in the direction of the trade. This gives you three-layer confirmation: the higher timeframe trend, the MACD momentum signal, and the candle close.
Stop-Loss Placement
Place the stop below the most recent swing low for longs, above the most recent swing high for shorts. Don’t use fixed pip stops on MACD strategies, as volatility varies by pair and timeframe.
Take Profit
Use a 1:2 or 1:3 risk-reward ratio. Alternatively, trail your stop using the MACD histogram: exit when the histogram reverses direction significantly after your entry.
For more on how technical indicators support trend strategies, check best technical indicators for swing trading and best moving averages for swing trading.
MACD Trading Strategy 5: MACD Histogram Fade
This is an advanced strategy that doesn’t rely on crossovers. Instead, it reads the histogram’s peaks and troughs to identify momentum exhaustion.
The logic: when the histogram bars keep growing, momentum is accelerating. When they start shrinking from a peak, momentum is fading. This fading often precedes a reversal or deep pullback.
Setup
- Identify a strong trending move with MACD histogram bars building in one direction
- Wait for the first histogram bar to be smaller than the previous one (momentum peak)
- Look for price to test a key support or resistance level at the same time
- Enter a counter-trend trade in the direction of the expected reversal
- Keep position size small, as counter-trend trades carry higher risk
MACD Trading Strategy 6: MACD Breakout Confirmation
Many traders use breakouts from consolidation zones as entry signals. MACD can serve as a confirmation tool before entering a breakout trade.
The approach: identify a consolidation zone (price trading in a tight range). When price breaks out, check MACD. If the MACD line has crossed above the signal line and is moving up through zero during a bullish breakout, it confirms momentum is backing the move. If it’s still below zero with a weak histogram, the breakout may be a false move.
Key Rule
Don’t wait for perfect MACD alignment before entering a breakout, or you’ll always be late. Use MACD as a filter, not a trigger. Enter on the breakout candle close, and if MACD is clearly moving in the wrong direction or showing divergence, skip the trade.
MACD on Different Timeframes: What to Expect
| Timeframe | MACD Behavior | Recommended Strategy |
| M5 / M15 | Many crossovers, high noise | Scalping with very tight risk management |
| H1 | Moderate signals, useful for day trading | Signal crossover with trend filter |
| H4 | Reliable signals, good for swings | Divergence, trend-following strategies |
| Daily | Slow but highly reliable signals | Zero-line crossover, divergence |
| Weekly | Major trend changes only | Position trading confirmation |
Common MACD Mistakes to Avoid
| Mistake | Why It’s Costly |
| Trading every crossover | Generates excessive false signals, especially on low timeframes |
| Ignoring trend direction | MACD signals against the main trend have lower success rates |
| No stop-loss | Momentum can persist longer than expected; unlimited losses possible |
| Using MACD alone | Single indicator strategies rarely outperform combined approaches |
| Over-optimizing settings | Custom settings that fit historical data often fail in live markets |
Defcofx: Trade with MACD on MT5
- Defcofx is a Saint Lucia-registered forex and CFD broker built on MetaTrader 5, which comes fully equipped with MACD and all the tools you need to execute these strategies:
- MT5 has the MACD indicator built in, with fully customizable settings for 12,26,9 or any other configuration.
- Fast execution – Defcofx’s infrastructure ensures your entries are filled at the price you see, which matters when trading time-sensitive MACD crossovers.
- Leverage up to 1:2000 – Manage your position size relative to your account with maximum flexibility.
- Spreads from 0.3 pips, no commissions, no swap fees – Low trading costs mean MACD-based strategies with frequent entries remain cost-effective.
- 40% Welcome Bonus on first deposits from $1,000 – All clients globally eligible.
- Withdrawals processed within 4 business hours, including weekends.
Statistics: MACD Usage in Forex Trading
- MACD consistently ranks as one of the top 3 most used technical indicators by retail forex traders globally, alongside RSI and moving averages.
- A study of retail forex traders found that traders who combined MACD with a trend filter had significantly lower drawdowns compared to those trading MACD signals in isolation.
- MACD divergence signals on daily charts have historically had a 60-65% accuracy rate when combined with price action confirmation, making them among the more reliable reversal setups in technical analysis.
- Algorithmic trading systems frequently use MACD as part of multi-factor momentum models, validating its continued relevance in professional trading environments.
For more on technical analysis tools available on MT5, check best technical indicators for forex and the traders dynamic index.
Final Thoughts on MACD Trading Strategies
MACD is one of the most versatile and time-tested indicators in forex trading. The signal line crossover, zero-line crossover, divergence, and histogram fade strategies each offer practical entry and exit frameworks. None of them are perfect on their own, but combined with trend context and price action confirmation, they give you a real edge.
The key is discipline: stick to your strategy rules, don’t take every signal, and always manage risk before looking at profit potential. MACD tells you about momentum, but trade management determines whether you profit from that information.
FAQ
The default 12, 26, 9 setting works well for swing trading on daily and H4 charts. Day traders often use faster settings like 5, 13, 1. Adjust based on your trading style and test before using live.
Yes, MACD is a reliable momentum indicator when used correctly. It works best when combined with a trend filter like the 200 EMA and price action confirmation. Using MACD alone without context leads to many false signals.
MACD divergence occurs when price and the MACD indicator move in opposite directions. Bullish divergence: price makes a lower low, MACD makes a higher low. Bearish divergence: price makes a higher high, MACD makes a lower high. Trade it by waiting for price action confirmation before entering.
MACD is most accurate on H4 and daily charts. Higher timeframes have less market noise, making signals more reliable. On M5 or M15, MACD generates many false crossovers.
Yes, but you need much faster settings like 3, 10, 16 and very strict risk management. Scalping with MACD requires quick decisions and tight stop-losses. It is better suited to experienced traders.
MACD measures momentum through moving average relationships and trend direction. RSI measures the speed and magnitude of price changes on a 0-100 scale. They complement each other well: MACD for trend and momentum, RSI for overbought/oversold conditions.
Use a trend filter (200 EMA) to only take signals in the direction of the main trend. Wait for candle confirmation before entering. Avoid trading MACD on low timeframes during low-liquidity periods.