


Are you ready to take your trading to the next level? Swing trading is all about catching those sweet, medium-term price moves that happen over a few days to weeks. But to do that, you need the right tools—enter the world of technical indicators! These magical tools help you figure out the best time to jump into and out of trades, so you’re always ahead of the game.
In this guide, we’ll explore the best technical indicators for swing trading, explain how they work, and show you how to use them like a pro (but with easy steps!). By the end, you’ll have a toolbox full of amazing indicators to crush your trading goals. Let’s go!
Moving Averages (MA)

Let’s start with one of the most popular and straightforward tools for swing trading: moving averages (MAs). A moving average is like a smoothed-out line that tracks the average price of a currency pair over a specific period. It helps you figure out the overall direction of the market—kind of like a compass pointing you toward the trend.
For swing traders, the two main types of moving averages you’ll use are:
- Simple Moving Average (SMA): This is the plain version, where the average price is calculated over a certain number of days (e.g., 50 days or 200 days). It’s great for spotting the big-picture trend.
- Exponential Moving Average (EMA): The EMA gives more weight to recent prices, so it reacts faster to price changes. This is perfect when you want to catch trends early.
Why Are Moving Averages Useful for Swing Trading?
Moving averages help you filter out the “noise” in price movements. Instead of seeing every little wiggle, you get a smooth line that shows the overall direction. They’re especially helpful for identifying trends and determining whether it’s time to buy or sell.
For example:
- If the price is above the moving average, the market is likely in an uptrend, and you might look for buying opportunities.
- If the price is below the moving average, it’s probably a downtrend, so selling might be the better option.
Golden Cross and Death Cross
Swing traders love using two moving averages together to spot crossovers, which are powerful trading signals. Here’s what they mean:
- Golden Cross: When a shorter moving average (like the 50-day) crosses above a longer one (like the 200-day), it’s a strong buy signal. Think of it as the market shouting, “The trend is up—jump in!”
- Death Cross: When the shorter moving average crosses below the longer one, it’s a sell signal, suggesting a downtrend is on the way.
How to Use Moving Averages in Swing Trading?
Here are some ways to incorporate moving averages into your swing trading strategy:
- Trend Identification: Use the 200-day SMA to see the long-term trend. If the price is consistently above it, the trend is bullish. Below it? Bearish.
- Dynamic Support and Resistance: Moving averages can act as support in an uptrend or resistance in a downtrend. For instance, if the price pulls back to the 50-day EMA and bounces back up, it might be a good time to buy.
- Crossover Strategies: Combine a faster moving average (like the 20-day EMA) with a slower one (like the 50-day SMA) to catch trend reversals early.
Real-Life Example
Imagine you’re trading EUR/USD, and the price has been trending up for a week. You notice that the 50-day EMA is above the 200-day SMA—a golden cross! This signals a strong uptrend, so you decide to buy. A few days later, the price starts to pull back but bounces off the 50-day EMA. You hold your position, confident that the trend is still intact.
Pro Tips for Moving Averages
- Experiment with Time Frames: Shorter MAs (like 10-day or 20-day) are great for catching quick moves, while longer ones (like 50-day or 200-day) help you see the big picture.
- Combine with Other Indicators: Use moving averages with RSI or Bollinger Bands for extra confirmation before entering a trade.
- Avoid Choppy Markets: Moving averages work best in trending markets, so skip them if the market is moving sideways.
Relative Strength Index (RSI)

Alright, let’s talk about our favorite tool for spotting when a currency pair is either “too hot” or “too cold”—the Relative Strength Index (RSI)! The RSI is a momentum indicator that measures how fast and how far prices have moved over a specific time period. Think of it as a speedometer for the market.
The RSI gives you a number between 0 and 100, and this number tells you whether a currency pair is overbought or oversold.
Here’s what you need to know:
- Above 70: The currency pair might be overbought, meaning it’s been climbing too fast and could be ready for a pullback.
- Below 30: The pair might be oversold, meaning it’s been falling too quickly and could be due for a bounce.
Why is RSI Important for Swing Trading?
Swing traders LOVE the RSI because it helps pinpoint key turning points in the market. If you’re looking for the best time to buy or sell during a swing trade, the RSI can be your secret weapon.
For example:
- If the RSI is above 70, it could be a good time to sell because the price might be ready to drop.
- If the RSI is below 30, it’s often a great time to buy, as the price might start climbing again.
How to Use RSI in Your Swing Trades?
Here’s how you can use the RSI to boost your swing trading game:
Spot Overbought and Oversold Conditions:
- Let’s say you’re watching USD/JPY. The RSI suddenly spikes to 80, signaling that the pair is overbought. This could be your cue to sell.
- A few days later, the RSI drops below 30. This signals oversold conditions, meaning it might be a good time to buy.
Divergences
Divergences happen when the RSI and the price move in opposite directions. For instance, if the price is making new highs but the RSI is dropping, this could signal a reversal.
Similarly, if the price is making new lows but the RSI is climbing, it might mean a bullish reversal is coming.
Combine with Support and Resistance
RSI works even better when you pair it with support and resistance levels. If the RSI says “oversold” and the price hits a key support level, that’s a strong signal to buy.
Real-Life Example
Imagine you’re trading GBP/USD, and the RSI hits 75. The pair has been rallying for several days, but now the price is near a resistance level. You decide to sell, expecting a pullback. Sure enough, the price starts to drop a few hours later, and you lock in a nice profit!
Pro Tips for RSI
- Avoid Using RSI Alone: Always pair it with other indicators, like moving averages or trendlines, for more reliable signals.
- Adjust the Settings: The default RSI period is 14, but you can experiment with shorter periods (like 7) for faster signals or longer ones (like 21) for smoother results.
- Watch for False Signals: Sometimes, the RSI can stay overbought or oversold for a while in strong trends. Be cautious and wait for confirmation before jumping in.
Bollinger Bands

It’s time to talk about one of the most fun and versatile indicators out there—Bollinger Bands! These handy bands are like stretchy rubber bands that wrap around the price, showing you how much it’s moving and whether the market is calm or wild.
Bollinger Bands consist of three parts:
- The Middle Band: This is just a moving average (usually 20 periods).
- The Upper Band: The middle band plus two standard deviations.
- The Lower Band: The middle band minus two standard deviations.
The bands expand and contract based on how volatile the market is. When the price is super jumpy, the bands spread out. When things are calm, they tighten up.
Why Bollinger Bands are Perfect for Swing Trading?
Swing traders love Bollinger Bands because they’re great at showing when the price is too high or too low. If the price gets too close to the upper band, it’s often a sign that it’s overbought and might drop soon. If it hugs the lower band, it’s probably oversold and could bounce back up.
Plus, when the bands get really tight, it’s like the market is holding its breath—and a big move might be just around the corner!
How to Use Bollinger Bands in Swing Trading?
Here’s how you can use Bollinger Bands to spot trading opportunities:
Identify Overbought and Oversold Levels
- If the price touches the upper band, it could mean the currency pair is overbought. This is a signal to look for selling opportunities.
- If the price touches the lower band, the pair might be oversold, signaling a buying opportunity.
Trade the Squeeze
- When the bands get super tight (a “squeeze”), it usually means the market is about to break out in one direction.
- Wait for the price to break out of the bands, then trade in the direction of the move.
Use as Dynamic Support and Resistance
The bands can act as support in an uptrend or resistance in a downtrend. For example, if the price pulls back to the middle band and bounces back up, it’s a sign the trend is continuing.
Real-Life Example
Let’s say you’re trading EUR/USD, and you notice the Bollinger Bands are squeezing tight. You wait for the price to break out above the upper band, signaling a bullish move. You enter a buy trade and ride the momentum for a few days, locking in a nice profit when the price stabilizes.
Pro Tips for Bollinger Bands
- Combine with Other Indicators: Bollinger Bands work great with RSI or MACD to confirm overbought or oversold conditions.
- Use Multiple Timeframes: Check the bands on different timeframes to see the bigger picture and avoid false signals.
- Stay Patient During a Squeeze: Don’t jump into a trade too early. Wait for the breakout to confirm the direction.
Fibonacci Retracement

Let’s dive into a trader favorite that feels like it’s straight out of a magical math movie—Fibonacci Retracement! This indicator uses special ratios to help you find key levels where prices might reverse or bounce. If you’ve ever wondered how to predict where the market might pause or change direction, Fibonacci is your secret weapon!
What is Fibonacci Retracement?
Fibonacci Retracement is based on a series of numbers discovered by a guy named Fibonacci (pretty cool name, right?). These numbers create ratios like 23.6%, 38.2%, 50%, and 61.8%. Swing traders use these levels to identify where the price might find support or resistance during a pullback.
Why is Fibonacci Retracement Awesome for Swing Trading?
When the market moves up or down, it doesn’t usually go in a straight line. Instead, it zigzags, taking little breaks before continuing in the same direction. These breaks are called retracements, and Fibonacci levels help you figure out where they might happen.
For example:
- A price moving up might pull back to the 38.2% or 61.8% level before continuing higher.
- A price moving down might bounce off the 50% level before dropping further.
How to Use Fibonacci Retracement in Swing Trading?
Here’s how to make the most of this indicator:
Draw the Fibonacci Lines
- Identify a recent swing high and swing low on your chart.
- Use the Fibonacci tool (available on most platforms) to connect the two points.
- The indicator will automatically plot the key Fibonacci levels for you.
Spot Support and Resistance
- If the price is moving up and then retraces to a Fibonacci level like 38.2%, it could act as support, signaling a potential buy.
- If the price is dropping and retraces to 61.8%, it might act as resistance, signaling a potential sell.
Combine with Other Tools
Use Fibonacci levels with moving averages or RSI to confirm your trades. For example, if the price hits the 50% retracement level and the RSI shows oversold, it’s a strong buy signal.
Real-Life Example
Imagine you’re trading GBP/USD, and it has been trending up. You draw Fibonacci levels from the swing low to the swing high. The price pulls back to the 38.2% level and starts to bounce. You enter a buy trade and ride the next wave higher, exiting when the price reaches the previous swing high.
Pro Tips for Fibonacci Retracement
- Don’t Use It Alone: Always combine Fibonacci levels with other indicators or price action signals to increase accuracy.
- Be Flexible: Prices don’t always stop exactly at Fibonacci levels. Use them as zones rather than precise lines.
- Watch for Confluence: If a Fibonacci level lines up with a moving average or a previous support level, it becomes even stronger.
MACD (Moving Average Convergence Divergence)

It’s time to meet one of the most powerful and versatile tools in swing trading—MACD (Moving Average Convergence Divergence)! This indicator is like having a multitool in your trading toolbox. It shows you trends, momentum, and even potential reversals—all in one simple setup.
What is MACD?
MACD consists of three key parts:
- MACD Line: The difference between two exponential moving averages (usually the 12-period and 26-period EMAs).
- Signal Line: A 9-period EMA of the MACD line.
- Histogram: This shows the difference between the MACD line and the signal line.
The MACD line and signal line move together, and when they cross, it gives you clues about the market’s direction. The histogram adds extra visual flair, showing you how strong the momentum is.
Why is MACD a Must-Have for Swing Trading?
Swing traders love the MACD because it does so much in just one indicator. It’s perfect for spotting:
- Trend Direction: Are we going up or down?
- Momentum Strength: How strong is the current move?
- Reversal Signals: Is the trend about to change direction?
By using MACD, you can time your trades with more precision and catch those sweet swings in the market.
How to Use MACD in Swing Trading?
Here are the main ways to use MACD like a pro:
Crossover Signals
- When the MACD line crosses above the signal line, it’s a bullish signal, meaning it might be time to buy.
- When the MACD line crosses below the signal line, it’s a bearish signal, signaling a potential sell.
Divergences
- If the price is making higher highs, but the MACD is making lower highs, this is called a bearish divergence and could signal a reversal downward.
- If the price is making lower lows, but the MACD is making higher lows, this is a bullish divergence, signaling a potential reversal upward.
Histogram Analysis
- When the histogram bars are growing taller, it means momentum is increasing in the current direction.
- When the bars start shrinking, it’s a sign momentum might be fading, and the trend could reverse.
Real-Life Example
Suppose you’re trading USD/JPY. The MACD line crosses above the signal line, and the histogram starts growing taller. This tells you the uptrend is strong, so you decide to buy. A few days later, the histogram bars start shrinking, and the MACD line crosses below the signal line. This signals that it’s time to close your position and take your profits!
Pro Tips for Using MACD
- Use with Other Indicators: Pair MACD with moving averages or Fibonacci retracement levels for even more accurate trade signals.
- Watch the Timeframe: MACD works best on 4-hour or daily charts for swing trading. Shorter timeframes might give too many false signals.
- Be Patient: Wait for a clear crossover or divergence before entering a trade. Don’t jump in too early!
Volume

Let’s turn up the volume—literally! Volume might not seem as flashy as some other indicators, but it’s one of the most important tools for swing trading. Volume measures how much a currency pair is being traded over a certain period. It shows you the market’s energy level: whether traders are active and engaged or taking a snooze.
Why is Volume Important for Swing Trading?
Volume is like the fuel behind price movements. When volume is high, it means lots of traders are in the game, which usually leads to stronger trends. When volume is low, the market might be indecisive or quiet, which can make trends fizzle out.
Here’s why swing traders rely on volume:
- Confirming Trends: Strong trends usually come with high volume. If the price is moving but volume is low, the trend might not last.
- Spotting Breakouts: Big breakouts often happen with a surge in volume. It’s a signal that something exciting is happening!
How to Use Volume in Swing Trading?
Trend Confirmation
- If the price is climbing and volume is increasing, it’s a good sign the trend is strong.
- If the price is falling but volume is decreasing, the downtrend might be losing steam.
Breakouts
Watch for a spike in volume when the price breaks above resistance or below support. High volume confirms the breakout is real.
Divergences
- If the price is making higher highs, but volume is dropping, it’s a sign the trend might reverse.
- Similarly, if the price is making lower lows but volume is increasing, it could signal a bullish reversal.
Real-Life Example
Suppose you’re trading EUR/USD, and the price has been moving sideways for a while. Suddenly, the price breaks above resistance, and volume spikes dramatically. This is your cue to jump into a buy trade, as the breakout is likely strong and backed by trader activity.
Pro Tips for Volume
- Combine with Other Indicators: Pair volume with Bollinger Bands or MACD to confirm breakouts or trends.
- Use Volume Indicators: Tools like the On-Balance Volume (OBV) or Volume Profile can add extra insights into market activity.
- Avoid Low-Volume Times: Be cautious about trading during low-volume hours, like when major markets are closed.
Stochastic Oscillator

Now let’s talk about another awesome indicator with a fun name: the Stochastic Oscillator! This tool is a momentum indicator that helps you figure out whether a currency pair is overbought (too expensive) or oversold (a bargain). It’s perfect for timing entries and exits during swing trades.
How Does the Stochastic Oscillator Work?
The Stochastic Oscillator compares the current price of a currency pair to its price range over a specific period (usually 14 periods). The result is a number between 0 and 100, and here’s how to interpret it:
- Above 80: The market might be overbought, meaning it’s due for a pullback.
- Below 20: The market might be oversold, meaning it’s ready for a bounce.
Why Swing Traders Love the Stochastic Oscillator?
Swing traders rely on this indicator because it’s super simple yet incredibly effective. It’s great for spotting turning points in the market and timing your trades perfectly.
How to Use the Stochastic Oscillator in Swing Trading?
Spot Overbought and Oversold Levels
- If the oscillator rises above 80, it could be a signal to sell.
- If it drops below 20, it’s often a signal to buy.
Use Divergences
- If the price is making higher highs, but the oscillator is making lower highs, it’s a bearish divergence and could signal a reversal downward.
- If the price is making lower lows, but the oscillator is making higher lows, it’s a bullish divergence and could signal a reversal upward.
Combine with Trends
- In an uptrend, look for oversold signals to buy during pullbacks.
- In a downtrend, look for overbought signals to sell during retracements.
Real-Life Example
Imagine you’re trading GBP/USD, and the price has been climbing steadily. The Stochastic Oscillator suddenly rises above 80, signaling that the pair is overbought. You decide to sell, and a few hours later, th price starts to drop, confirming your trade decision!
Pro Tips for the Stochastic Oscillator
- Don’t Use It Alone: Always pair it with other indicators like moving averages or trendlines for confirmation.
- Adjust the Settings: The default setting is 14 periods, but you can tweak it for faster or slower signals based on your trading style.
- Watch for False Signals: Like RSI, the Stochastic Oscillator can stay overbought or oversold during strong trends, so wait for confirmation before acting.
Parabolic SAR

Let’s talk about the Parabolic SAR, a simple yet super helpful tool for spotting trends and knowing when to jump in or out of a trade. SAR stands for “Stop and Reverse,” which tells you exactly what this indicator does—it shows you when a trend might be ready to stop and reverse direction.
How Does the Parabolic SAR Work?
The Parabolic SAR places dots on your chart:
- Dots below the price: This means the market is in an uptrend.
- Dots above the price: This signals a downtrend.
As the price moves, these dots trail behind, acting like a guide to show where the trend might go next.
Why Swing Traders Love the Parabolic SAR?
The Parabolic SAR is perfect for swing trading because it gives clear, easy-to-read signals. You can use it to:
- Identify the current trend direction.
- Spot potential reversals.
- Set stop-loss levels to protect your trades.
How to Use Parabolic SAR in Swing Trading
Follow the Trend
- If the dots are below the price, stick with long (buy) trades.
- If the dots are above the price, focus on short (sell) trades.
Spot Reversals
- When the dots flip from below the price to above it, that’s a signal the trend might be reversing downward.
- When the dots flip from above to below, the trend might be reversing upward.
Set Stop-Loss Levels
- Use the dots as a dynamic stop-loss level. If the price hits a dot, it’s a sign to exit your trade.
Real-Life Example
Imagine you’re trading EUR/USD, and the Parabolic SAR shows dots below the price, confirming an uptrend. You buy and ride the trend higher. A few days later, the dots flip above the price, signaling a reversal. You close your position and lock in your profits!
Pro Tips for Parabolic SAR
- Best for Trending Markets: This indicator works best in trending markets and might give false signals in choppy, sideways conditions.
- Pair with Other Indicators: Combine Parabolic SAR with moving averages or RSI for more reliable signals.
- Adjust the Settings: Tweak the acceleration factor to suit your trading style—higher values make it more sensitive to price changes.
The Parabolic SAR is one of the most user-friendly swing trading indicators, making it a must-have for spotting trends and managing risk effectively.
Average True Range (ATR)
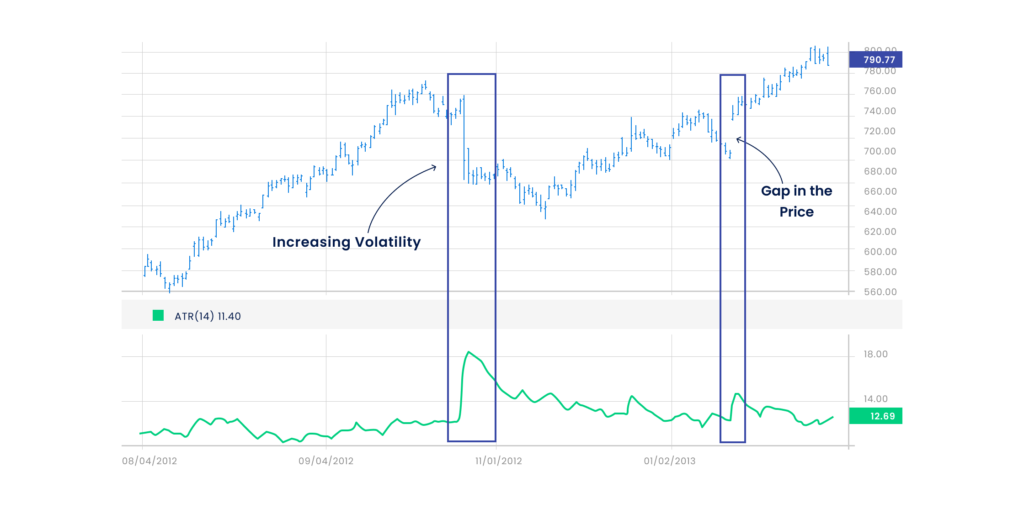
Next up is the Average True Range (ATR)—an amazing tool that helps you understand how much a currency pair typically moves. While it doesn’t tell you the direction of the market, it’s a rockstar for measuring volatility.
What is ATR?
ATR calculates the average range between the high and low prices over a specific number of periods. In simple terms, it tells you how “wild” or “calm” the market is.
Why is ATR Important for Swing Trading?
Swing traders use ATR to:
- Set Stop-Loss Levels: ATR helps you place your stop-loss orders at a safe distance, reducing the chance of getting stopped out by random price swings.
- Gauge Volatility: High ATR values mean the market is volatile, while low ATR values indicate a calmer market.
How to Use ATR in Swing Trading?
Set Stop-Loss Levels
- Multiply the ATR value by a certain factor (like 1.5 or 2) and place your stop-loss that far from your entry price.
- For example, if the ATR is 20 pips, set your stop-loss 30-40 pips away.
Identify Volatility Trends
- If ATR is rising, the market is becoming more volatile. This is a signal to expect bigger price moves.
- If ATR is falling, the market is calming down, and trends might last longer.
Combine with Breakout Strategies
High ATR values often accompany big breakouts. Use ATR with Bollinger Bands or support/resistance levels to spot breakout opportunities.
Real-Life Example
Suppose you’re trading USD/JPY, and the ATR shows a value of 50 pips. You enter a buy trade and set your stop-loss 75 pips below your entry point (50 x 1.5). The trade runs smoothly, and your stop-loss stays safe, even during small pullbacks.
Pro Tips for ATR
- Combine with Trends: Use ATR with moving averages or trendlines to find high-probability trade setups.
- Avoid Over-Tight Stops: ATR prevents you from setting stops too close to the price, which reduces the chance of getting stopped out prematurely.
- Adjust Timeframes: Check ATR on different timeframes to suit your swing trading strategy.
ATR is one of the best technical indicators for swing trading because it helps you manage risk like a pro. Use it to stay calm and confident, even in wild markets!
Ichimoku Cloud

Now for the grand finale—the Ichimoku Cloud, a powerful all-in-one indicator that might look intimidating at first but is worth learning. This tool shows support, resistance, trend direction, and momentum all in one glance.
What is the Ichimoku Cloud?
The Ichimoku Cloud consists of five key components:
- Tenkan-Sen (Conversion Line): A short-term trend indicator.
- Kijun-Sen (Base Line): A medium-term trend indicator.
- Senkou Span A & B (Cloud): The area between these spans forms the “cloud,” showing future support and resistance levels.
- Chikou Span (Lagging Line): A lagging indicator that shows the relationship between the current price and past prices.
Why Swing Traders Love the Ichimoku Cloud?
The Ichimoku Cloud is like a cheat sheet for swing traders. It gives you instant insights into:
- Trend Direction: The cloud’s position and color indicate whether the market is bullish, bearish, or neutral.
- Support and Resistance Levels: The cloud acts as a dynamic area of support or resistance.
- Momentum: The lines and cloud thickness show how strong the trend is.
How to Use Ichimoku Cloud in Swing Trading?
Identify Trend Direction
- If the price is above the cloud, it’s a bullish trend.
- If the price is below the cloud, it’s a bearish trend.
Spot Support and Resistance
The cloud acts as support in an uptrend and resistance in a downtrend.
Use Crossovers
- When the Tenkan-Sen crosses above the Kijun-Sen, it’s a bullish signal.
- When it crosses below, it’s a bearish signal.
Real-Life Example
Imagine you’re trading AUD/USD, and the price is above a thick green cloud, signaling a strong uptrend. You enter a buy trade and use the cloud as your support level. As long as the price stays above the cloud, you hold your position, riding the trend for maximum profits.
Pro Tips for Ichimoku Cloud
- Practice First: The Ichimoku Cloud has many components, so spend time practicing on a demo account before using it in live trades.
- Pair with Simpler Indicators: Use Ichimoku with RSI or MACD for confirmation.
- Stick to Trending Markets: This indicator works best in strong trending markets and might give false signals in choppy conditions.
Conclusion
Using the best technical indicators for swing trading can make your life so much easier, and pairing them with the right platform makes it even better. That’s where Defcofx comes in!
With high leverage options up to 1:2000, ultra-low spreads starting at 0.3 pips, and a 40% welcome bonus on deposits of $1,000 or more, Defcofx gives you the edge you need to succeed.
Plus, we process withdrawals within 4 business hours (even on weekends!) and provide multilingual support for traders worldwide. Why wait? Start your swing trading journey with us at Defcofx today!
FAQs
What is swing trading?
Swing trading is a style of trading where you hold positions for a few days to weeks to capture medium-term price movements.
What are the best swing trade indicators for beginners?
Indicators like Moving Averages, RSI, and MACD are great for beginners because they’re simple yet powerful.
Can I use multiple indicators at once?
Yes! Combining indicators like RSI with Bollinger Bands can give you more accurate signals. Just don’t overcrowd your charts.
Why is volume important in swing trading?
Volume confirms price movements. High volume means the trend is strong, while low volume might signal a weak or fake move.
Why should I choose Defcofx for swing trading?
Defcofx offers high leverage, low fees, fast withdrawals, and top-notch support, making it the perfect platform for swing traders!
Preferred Topics by Defcofx
You can also explore the following topics, which are highly preferred by Defcofx: