


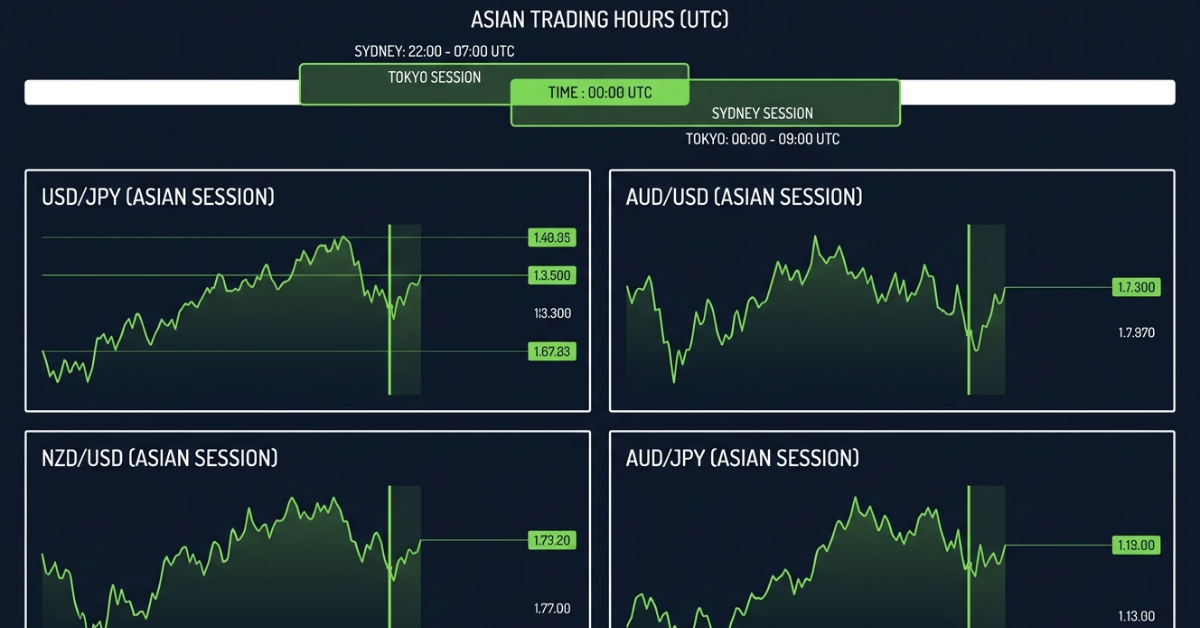
Some of the top technical analysis indicators for currency pair EUR/AUD are Moving Average (MA), Relative Strength Index (RSI), MACD, Bollinger Bands, Fibonacci Retracement, Average True Range (ATR). These indicators are helpful tools for trading the EUR/AUD currency pair as they enable traders to spot trends, momentum, volatility and probable entry and exit points.
Highlights
- EUR/AUD is a pair with strong trends and high volatility phases.
- Moving Averages serve to discern the overall trend.
- RSI and MACD are momentum and reversal indicators .
- Bollinger Bands and ATR are used by traders to measure market volatility.
- Using a combination of indicators generally provides more reliable trade indications than one tool.
EUR/AUD Currency Pair Overview
EUR/AUD is the exchange rate of the Euro against the Australian Dollar. It tells you how many Australian Dollars you need to buy one Euro.
The pair is under the effect of the economic situation in the Eurozone and Australia. Price changes can be influenced by interest rate decisions from the European Central Bank (ECB) and the Reserve Bank of Australia (RBA), inflation data, employment reports, commodity prices, and overall market mood.
The Australian Dollar is frequently seen as a commodity-linked currency, therefore it can be affected by movements in iron ore prices, and worldwide demand and the Chinese economy. The mix of elements makes the pair favorable to swing traders and trend traders searching for sustained market moves.
1. Moving Average (MA)
Moving Averages are one of the most popular indicators for trading EUR/AUD since they represent the direction of the existing trend in a straightforward fashion.
The indicator smooths price fluctuations by calculating the average closing price over a selected period, this makes it easier to identify whether buyers or sellers currently control the market.
Many traders use combinations such as:
- 20-period Moving Average
- 50-period Moving Average
- 200-period Moving Average
When the shorter Moving Average crosses above a longer one, it may indicate strengthening bullish momentum. A downward crossover may suggest increasing bearish pressure.
Since EUR/AUD often develops strong trends, Moving Averages can help traders avoid entering positions against the broader market direction.
2. Relative Strength Index (RSI)
The Relative Strength Index measures market momentum by comparing recent gains with recent losses.
The RSI moves between 0 and 100.
Generally:
- Above 70 may indicate overbought conditions.
- Below 30 may indicate oversold conditions.
However, experienced traders understand that strong trends can remain overbought or oversold for extended periods.
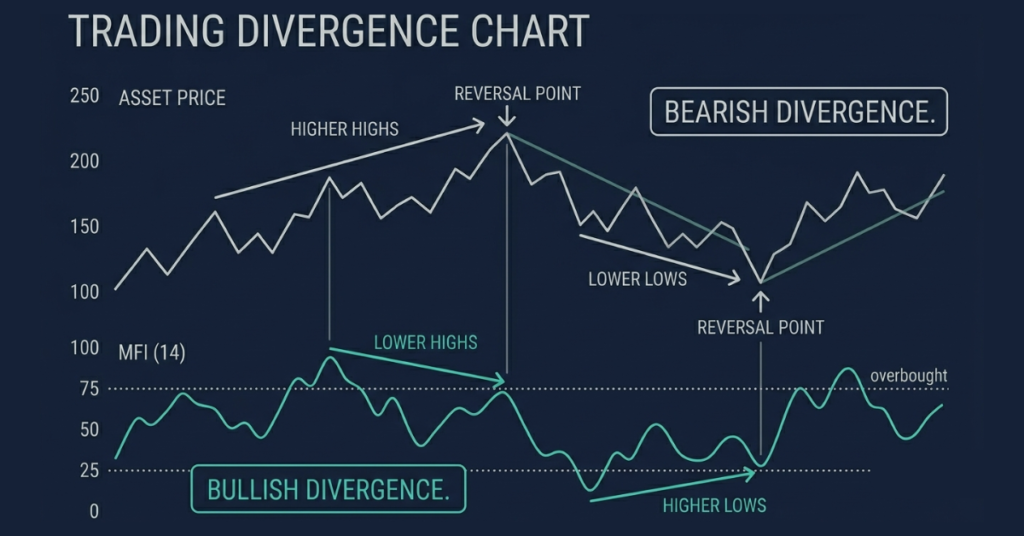
Instead of treating RSI as a standalone buy or sell signal, many traders use it to confirm price action or identify weakening momentum before potential reversals.
The RSI can be particularly useful when EUR/AUD begins slowing after an extended trend.
3. MACD (Moving Average Convergence Divergence)
MACD combines trend analysis with momentum, making it one of the most popular indicators for forex trading.
The indicator includes:
- MACD Line
- Signal Line
- Histogram
When the MACD Line crosses above the Signal Line, bullish momentum may be strengthening. A crossover below the Signal Line may suggest increasing selling pressure.
The histogram also helps traders identify whether momentum is accelerating or weakening before price changes become obvious on the chart.
MACD performs particularly well on EUR/AUD because the pair often experiences sustained directional moves rather than constant sideways trading.
4. Bollinger Bands
Bollinger Bands measure market volatility by placing upper and lower bands around a Moving Average.
As volatility increases, the bands expand. During quieter market conditions, they contract.
EUR/AUD frequently alternates between consolidation periods and strong trending phases, making Bollinger Bands useful for identifying potential breakout opportunities.
Many traders watch for:
- Band squeezes before breakouts.
- Strong trend continuation when price rides the outer band.
- Potential exhaustion after unusually large price extensions.
Bollinger Bands should always be combined with additional confirmation rather than used as standalone trading signals.
5. Fibonacci Retracement
Fibonacci Retracement is widely used to identify potential support and resistance levels during market pullbacks.
After a strong upward or downward move, traders draw Fibonacci levels between the swing high and swing low to estimate where price may temporarily retrace before continuing its trend.
The most commonly monitored levels include:
- 23.6%
- 38.2%
- 50%
- 61.8%
- 78.6%
Because EUR/AUD often trends for extended periods, Fibonacci retracements can help traders identify lower-risk entries during pullbacks instead of chasing price after large moves.
6. Average True Range (ATR)
ATR is different from indicators that anticipate the direction of the market; it measures volatility.
The higher the ATR readings, the more the price will change. The lower the ATR, the calmer the market is.
Many EUR/AUD traders use ATR to:
- Set realistic stop-loss distances.
- Determine position sizing.
- Estimate expected daily movement.
- Adapt to changing market volatility.
ATR helps traders avoid placing stop-losses too close to the usual ebb and flow of the market, which can be greatly impacted by central bank statements or economic news that can affect EUR/AUD volatility.
Which indicators work best together?
No indicator provides perfect trading signals on its own. Many professional traders combine indicators that measure different aspects of the market.
For example:
| Indicator | Primary Purpose |
| Moving Average | Trend direction |
| RSI | Momentum |
| MACD | Trend confirmation |
| Bollinger Bands | Volatility |
| Fibonacci Retracement | Support and resistance |
| ATR | Risk management |
Traders get a more holistic view of the market conditions rather than just a single signal through supplementary indicators.
8 Factors that influence EUR/AUD
Through the combination of a grasp of fundamental market dynamics and technical indicators, the effectiveness of the former is increased.
The EUR/AUD exchange rate is frequently affected by a number of events, including the following:
- The European Central Bank makes decisions on interest rates.
- Pronouncements made by the Reserve Bank of Australia regarding its policies.
- There are reports of inflation.
- The data on employment.
- GDP growth.
- Prices of several commodities.
- The economic performance of their country.
- The global perspective on risk.
An approach to trading that is more balanced can be achieved by monitoring these events in conjunction with technical indicators.
6 Best practices for trading EUR/AUD
Technical analysis and disciplined risk management are often two components that successful traders of the EUR/AUD pair employ.
Among the practical guidelines are the following:
- Make your trades in the direction of the trend that is higher in period.
- Utilize a number of different indicators to validate the technical indications.
- Prior to entering positions, it is important to monitor economic calendars.
- Every trade should have a stop-loss order in place.
- Keep the sizes of the positions consistent.
- On a regular basis, review completed trades in order to discover areas that could use improvement.
When it comes to trading, developing a procedure that can be repeated is frequently more helpful than continuously looking for fresh signs.
Trade EUR/AUD with Defcofx
When trusted trading tools and lightning-fast execution are used in conjunction with technical indicators, their value increases even further.
Through MetaTrader 5, Defcofx ensures that traders have access to a wide variety of foreign exchange pairs, including the EUR/AUD pair. Traders can take advantage of spreads beginning at 0.3 pips, commission-free trading, leverage of up to 1:2000, and withdrawals processed within four business hours. These features make it simpler for traders to evaluate markets and effectively implement trading strategies.
Open a Live Trading AccountFrequently Asked Questions
When trading the EUR/AUD, which indicators work best?
While analyzing the EUR/AUD, many indicators are utilized, including Moving Averages, RSI, MACD, Bollinger Bands, Fibonacci Retracement, and ATR.
In terms of technical analysis, is the EUR/AUD a suitable pair?
Traders that depend on chart analysis will find EUR/AUD to be a suitable market because it frequently generates strong trends and clear technical patterns.
Would you say that the EUR/AUD pair is a good one for RSI to use?
To answer your question, yes. RSI is a popular tool for measuring momentum and spotting possible overbought or oversold situations, particularly when used in conjunction with other indicators.
What is the value of ATR for the EUR/AUD pair?
With ATR, traders can gauge market volatility, which in turn helps them manage position sizes and set better stop-loss levels.
Is it a good idea to integrate different indicators?
Yes. To enhance the accuracy of their analysis and decrease the number of false signals, many traders use a combination of trend, momentum, and volatility indicators.
What news stories have the most impact on the EUR/AUD exchange rate? 6.
A plethora of factors influence the fluctuations in the EUR/AUD exchange rate, including interest rate decisions, reports on inflation, employment statistics, commodity prices, data from China’s economy, and pronouncements from the ECB and RBA.
Final Thoughts
Moving Averages, Relative Strength Index, Moving Average Convergence/Divergence, Bollinger Bands, Fibonacci Retracement, and Average True Range (ATR) are the top technical analysis indicators for the EUR/AUD pair because they offer unique perspectives on trend direction, momentum, volatility, and risk management.
Although there is no surefire way to earn money in trading, traders can improve their odds of success by utilizing a combination of indicators, thorough market research, and disciplined risk management. The prospects in the EUR/AUD forex pair can be better navigated by traders who use a structured strategy and a dependable trading platform.