


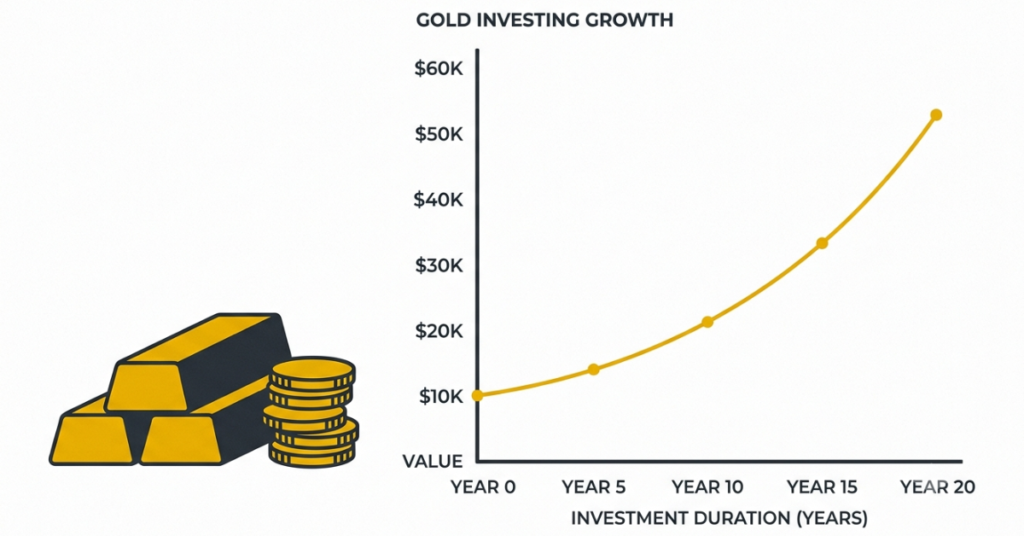
A $10,000 investment in gold made around 2006, when gold averaged approximately $604 per troy ounce, would have bought roughly 16.6 ounces. With gold trading near $4,000 per ounce today, that position would be worth in the region of $66,000 a return of well over 500 percent before accounting for storage, insurance, or inflation.
Important Insights
- Gold averaged roughly $604 per ounce in 2006, compared to a price in the region of $4,000 per ounce in mid-2026.
- A $10,000 position from 20 years ago would have grown to somewhere around $66,000 based on those reference prices, though the exact figure shifts with the specific entry and exit dates.
- Gold’s rise over this period was driven by the 2008 financial crisis, a prolonged low interest rate environment, and more recently by inflation concerns and central bank buying.
- Unlike dividend-paying stocks, physical gold does not generate income on its own; the return comes entirely from price appreciation.
The Math, Step by Step
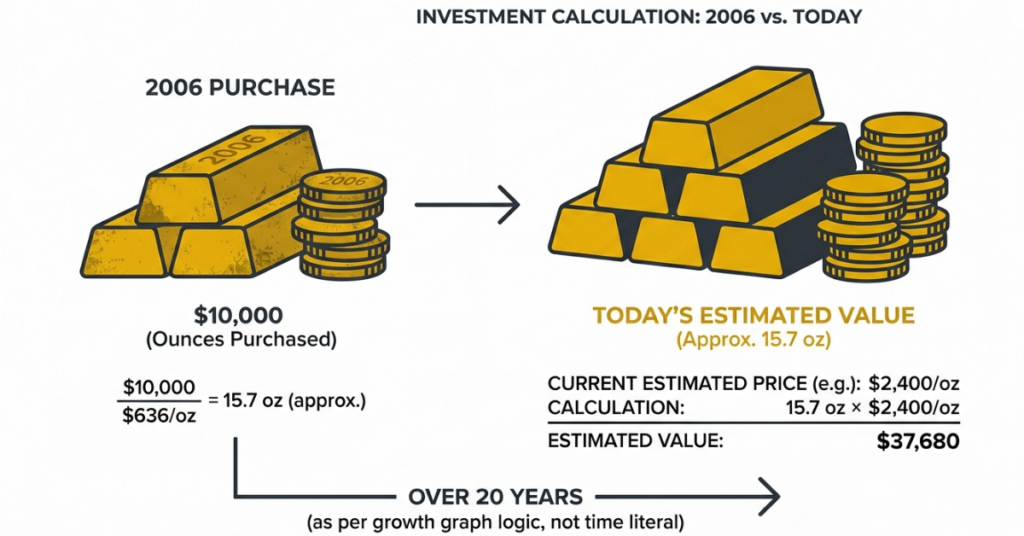
- Divide the amount invested by the price per ounce at purchase: $10,000 ÷ $604 per ounce (2006 average) ≈ 16.6 ounces.
- Multiply that by today’s price: 16.6 ounces × $4,000 per ounce (approximate mid-2026 price) ≈ $66,400.
- Subtract the original stake to find the gain: $66,400 − $10,000 ≈ $56,400, an increase of more than 560 percent over the two-decade period.
This is an illustrative calculation using historical averages and a current spot price actual results depend on the exact purchase and sale dates, since gold prices fluctuate daily, and it excludes any storage costs, insurance, dealer premiums, or taxes a real-world investor would also need to factor in.
Gold vs a Hypothetical Cash Position
| Scenario (20-year period) | Starting Value | Approximate Ending Value |
| $10,000 in physical gold (2006 avg. price) | $10,000 | ~$66,000 |
| $10,000 held as cash (no interest) | $10,000 | $10,000 (loses purchasing power to inflation) |
This comparison is illustrative rather than a full financial analysis, since it excludes taxes, storage costs for physical gold, and the interest a cash deposit could have earned. It is intended only to show why gold is often discussed as a long-term store of value relative to holding uninvested cash.
What Drove Gold’s Price Over 20 Years
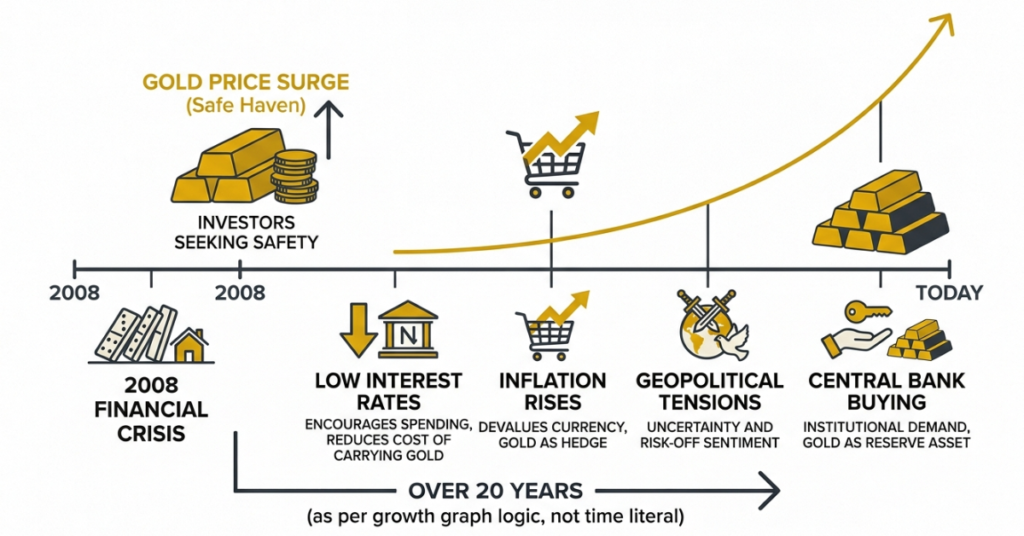
Gold’s climb from roughly $600 to around $4,000 an ounce didn’t happen in a straight line.
The 2008 global financial crisis pushed investors toward gold as a safe-haven asset, and the extended period of low interest rates that followed reduced the opportunity cost of holding a non-yielding asset like gold. More recently, persistent inflation concerns, geopolitical tensions, and sustained central bank gold purchases have been widely cited as continuing to support demand.
Gold has also seen periods of stagnation and decline within this window, including a multi-year pullback after its 2011 peak, a reminder that the path was not a smooth, uninterrupted climb. An investor who bought near that 2011 peak and held for a shorter period would have seen a very different outcome than one who bought in 2006.
Physical Gold vs Trading Gold as a CFD
The biggest difference is simple: physical gold is ownership, while a gold CFD is price exposure. When you buy physical gold, you own the metal and think in terms of long-term wealth preservation. When you trade a gold CFD (XAU/USD), you are trading gold’s price movement without owning the underlying metal.
| Feature | Physical Gold | Gold CFD (XAU/USD) |
|---|---|---|
| What you own | Actual gold bars, coins, or bullion | A contract tracking gold price movements |
| Main purpose | Long-term holding and wealth preservation | Short-term trading and speculation on price movements |
| Ownership | You own the physical asset | You do not own the gold itself |
| Time horizon | Usually months to decades | Commonly minutes, hours, days, or weeks |
| Buying direction | Usually buy and hold, then sell later | Can trade both rising and falling markets (buy or sell positions) |
| Storage requirements | Requires secure storage, and possibly insurance | No physical storage or insurance needed |
| Capital requirement | Requires paying the full value upfront | Uses margin, allowing traders to control larger positions with less upfront capital |
| Trading flexibility | Selling may require finding a buyer or dealer | Positions can usually be opened and closed quickly through a trading platform |
| Costs involved | Dealer premiums, storage, insurance, and selling spreads | Spread, possible commissions, and overnight financing charges |
| Best suited for | Investors looking for long-term gold exposure | Traders looking to take advantage of gold price movements |
A Practical Example
Imagine gold is trading at $3,000 per ounce.
- A physical gold buyer purchases gold because they believe it will preserve or increase value over many years. Their focus is ownership, security, and long-term price appreciation.
- A gold CFD trader may open a buy position if they expect gold to rise after an interest-rate announcement, or a sell position if they expect prices to fall. Their focus is the price movement, not owning the metal.
At Defcofx, we often see new traders compare CFDs with physical gold as if they are the same product. They aren’t. Physical gold is designed for holding; CFDs are designed for trading. The right choice depends on whether your goal is building a long-term gold position or actively trading market opportunities.
Trade Gold with DefcofxGold’s Long-Term Track Record
A look at gold’s historical price journey, market demand, and its role as a globally recognized precious metal.
Gold Price Level
Gold traded around the $600 per ounce range, marking the beginning of a major long-term price cycle.
Historic Peak
Gold reached a major high before entering a multi-year period of consolidation and price weakness.
Record-Breaking Year
Gold recorded multiple all-time highs, supported by investment demand, economic uncertainty, and strong market interest.
Global Market Focus
Gold continued trading at historically elevated levels while markets monitored inflation, interest rates, and global risks.
Key Gold Statistics
Why Investors Watch Gold
Gold is often considered by investors as a diversification asset and a potential hedge during periods of inflation, currency weakness, and economic uncertainty. However, gold prices can also experience extended periods of decline or limited movement.
FAQ
Using a 2006 average price of about $604 per ounce and a mid-2026 price near $4,000 per ounce, the position would be worth roughly $66,000, though the exact figure depends on specific purchase and sale dates.
Gold has historically preserved and grown purchasing power over multi-decade periods, though it does not generate income like dividends or interest, and its price can stagnate for years at a time.
No, the example above is a simplified illustration based on price appreciation only, and does not account for real-world costs like storage, insurance, dealer premiums, or taxes.
Key drivers include the 2008 financial crisis, a prolonged low interest rate environment, persistent inflation concerns, and sustained central bank gold buying in recent years.
Yes, gold CFDs let traders speculate on gold’s price movements without taking physical delivery or handling storage.
Yes, Defcofx offers gold trading on MetaTrader 5 with spreads from 0.3 pips, zero commission, and leverage of up to 1:2000 on eligible accounts.
Explore More Helpful Forex Articles with Defcofx
- Who Benefits from a Weak U.S. Dollar?
- Which Country Has the Lowest Value of $1?
- How Much Commission Does MetaTrader 5 Take?
- How Can You Protect Your Savings from a Weak Dollar?
- Another Names for US30 in Forex
- How to Trade US30
- Best Time to Trade NAS100
- How Many Stocks Are on the Nasdaq?
- What Is the Difference Between Dow Jones and Nasdaq?
- How Much Do I Need to Trade NAS100?