


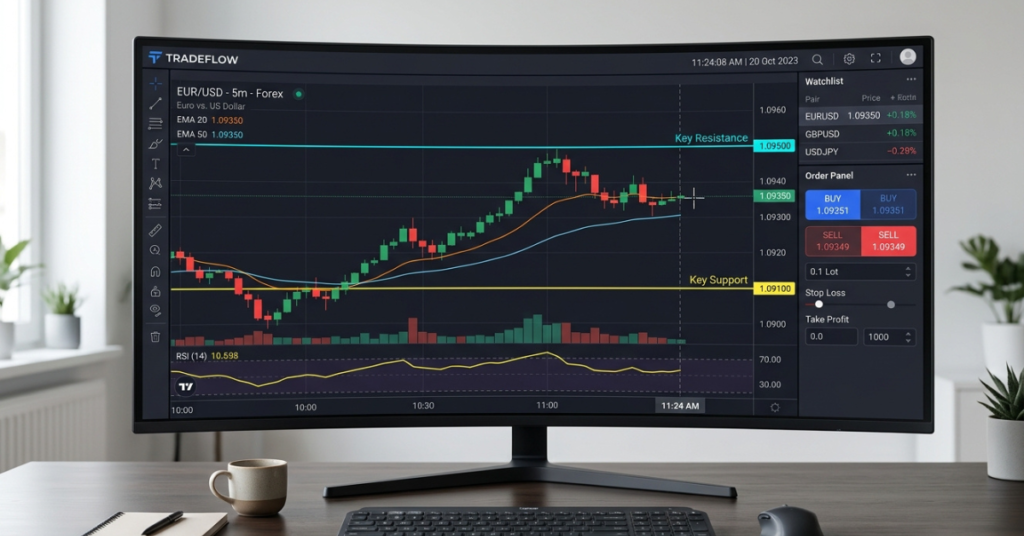
Candlestick charts are a useful starting point for forex day trading because they show open, high, low, and close prices. Bar charts provide the same data, while line charts simplify the view. No chart guarantees profitable trades. Choose a format and timeframe that suit your tested strategy.
Key takeaways
- Candlestick charts are widely used for day trading and display the same four price data points as OHLC bar charts.
- Bar (OHLC) charts offer the same four data points in a compact format; the choice between bars and candles is largely a matter of preference.
- Line charts are better for identifying the overall trend than for finding precise entry points.
- Heikin Ashi charts use calculated prices to smooth trends. Confirm entries and exits against actual bid and ask quotes.
- Renko bricks form around price-movement thresholds instead of equal time periods. Brick size and the data source affect the result.
Five chart types for forex day trading
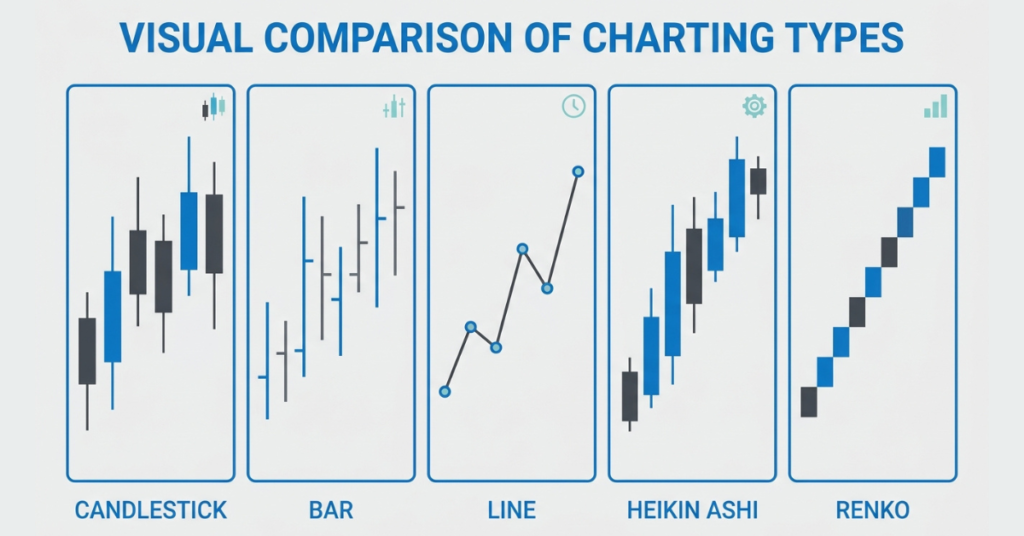
Not every chart type is built for the pace of day trading. Here is a breakdown of each one, what it shows, and when it is actually useful.
| Chart Type | Data Shown | Best For | Weakness |
| Candlestick | Open, High, Low, Close; price-action interpretation | Reading intraday OHLC price action | Can feel cluttered on small screens |
| Bar (OHLC) | Open, High, Low, Close | Compact OHLC display | Harder to read sentiment quickly |
| Line | Usually each period’s close | Trend identification, big-picture view | Misses intraday price action detail |
| Heikin Ashi | Averaged OHLC, trend smoothing | Trend-following, momentum trades | Calculated prices; can delay signals |
| Renko | Price movement only (no time) | Filtering noise, breakout spotting | Uneven time intervals; synthetic brick prices |
How candlestick charts show price action
A completed candlestick displays four prices for its period. The body spans the open and close, while the wicks extend to the high and low. An upper wick shows that price reached above both the open and close. Traders may interpret a long upper wick as rejection of higher prices, but its meaning depends on the surrounding trend and price levels. It does not prove the cause of a move or predict a reversal.
For forex day traders, candles help show how prices changed within each interval. A hammer, engulfing pattern, or morning star may support a trading hypothesis, but each needs context and can fail. A line chart omits the intrabar OHLC detail needed to identify these patterns. The current candle is still forming, so its shape can change before the period closes.
If you are learning which indicators pair best with your chart, read our guide on best technical indicators for day trading to build a clean setup that does not slow your decisions.
Choosing timeframes for forex day trading
One hour, three views: Between 09:00 and 10:00, an M5 chart contains 12 five-minute candles, an M15 chart contains four fifteen-minute candles, and an H1 chart contains one hourly candle. On the same price feed, each longer candle combines the shorter periods: its open is the first open, its high and low are the highest and lowest prices, and its close is the final close.
The chart type and the timeframe work together. Here are examples of how day traders can use them:
| Timeframe | Common Use | Trader Type |
| 1-minute chart | Scalping, ultra-fast entries | Scalpers |
| 5-minute chart | Short-term setups, momentum trades | Active day traders |
| 15-minute chart | Entry signals with trend bias from higher frame | Day traders |
| 1-hour chart | Broader intraday trend context | Day traders seeking context |
| 4-hour chart | Bigger picture, key support and resistance levels | Traders checking broader levels |
For more on timeframe selection, our article on day trading patterns covers how specific chart patterns behave differently across different timeframes.
Open a Live AccountCheck bid, ask, and trading costs
MT5 charts for OTC forex symbols are normally built from bid quotes. Buy positions open at the ask and close at the bid; sell positions open at the bid and close at the ask. The spread separates these prices. Enable the Ask price line in chart properties to see the current ask alongside the bid chart. This helps explain why a sell stop-loss can trigger even when the visible bid candle appears below the stop level.
For example, if EUR/USD is quoted at bid 1.1000 and ask 1.1002, the spread is 0.0002, or 2 pips. A market buy opens near 1.1002, while an immediate exit is near 1.1000, before any slippage or other applicable charges. Smaller timeframes do not remove these costs. For forex pairs, a pip is usually 0.0001; for most yen pairs it is 0.01.
Compare your chart signals with spreads, slippage, position size, and upcoming economic releases. Stop-loss orders help manage risk, but the execution price can differ during gaps or fast markets. These are educational examples, not trade recommendations.
Using Heikin Ashi and Renko charts
Heikin Ashi for trend analysis
Heikin Ashi candles calculate their open and close using current and previous price data. This smooths the display and can make trends easier to follow, but it can delay signals. Calculated candle values can differ from market quotes, although some highs or lows may coincide with actual prices. Use ordinary candlesticks and current bid and ask quotes when setting entry, stop-loss, and take-profit levels.
Renko bricks and price movement
Renko charts only print a new brick when price moves by a defined amount, ignoring time entirely. With a fixed 10-pip brick size on EUR/USD, a continuation brick represents a further 10-pip move beyond the previous brick boundary; reversal rules and data sources depend on the chart implementation. This cuts out a lot of market noise, making strong trends and consolidation phases easier to see. Bricks do not represent equal time intervals, and their synthetic price levels can differ from executable market prices. Some platforms retain timestamps or display volume, so those features do not necessarily disappear. Check orders and backtests against actual market prices.
Practise forex chart analysis with Defcofx
Defcofx offers MetaTrader 5, which supports three native chart modes: candlestick, bar, and line. On MT5 desktop, use the Charts menu or chart toolbar to switch modes. MT5 provides 21 predefined timeframes from one minute to one month and supports built-in and compatible custom indicators. Heikin Ashi requires an indicator, while Renko generally requires a custom indicator or custom-symbol solution; these are not native chart modes.
| Feature | Defcofx Offer |
| Spreads | From 0.5 pips |
| Leverage | Up to 1:2000 on the Silver account; up to 1:500 on the Gold account. Instrument limits and temporary adjustments apply. |
| Commissions | Zero |
| Swap Fees | Zero |
| Welcome Bonus | 40% on an eligible new client’s first deposit of $1,000+. Bonus terms include verification, country exclusions, and non-withdrawable credit; receive approval before trading. |
| Withdrawals | Typically around 3 hours according to the withdrawal page; eligibility, processing and network conditions apply |
| Platform | MetaTrader 5 (MT5) |
| Account Types | Silver and Gold live accounts; demo practice available |
Want to test your chart setup without risking real money? Open a free demo account on Defcofx and practice reading supported charts with simulated funds and market quotes.
Ready to trade with real charts and real markets? Open a live trading account on Defcofx and check the current account and instrument conditions before funding. High leverage increases both potential gains and losses.
Open a Demo AccountBefore funding, review the account conditions and withdrawal requirements. The withdrawal page lists a $10 USDT withdrawal fee, possible wallet-provider fees, and restrictions on Saturday requests when positions remained open on Friday. Processing estimates are not a guarantee of arrival in your wallet. Confirm any promotion with support before claiming it. Bonus credit is not withdrawable, and withdrawals or internal transfers cancel it.
Build a consistent forex chart setup
Choosing a chart for day trading does not need to be complicated. Candlesticks provide a clear view of OHLC price data and price-action patterns, while line, bar, Heikin Ashi, and Renko charts each have specific uses. Start with standard candlesticks, focus on a manageable timeframe, and build your reading skills before adding more tools.
The goal is not to find a chart that guarantees better trades. It is to use a chart that gives you enough information to make consistent decisions without unnecessary noise. Practise your setup on a demo account first, then adjust your chart and timeframe as your trading experience develops.
Frequently asked questions about trading charts
Start with a 5-minute or 15-minute candlestick chart. It is visual, widely used, and covered in most educational resources, so learning on it means your reading of patterns directly transfers to real-world trading discussions.
Yes. Line charts can simplify trend and support-and-resistance analysis, and some strategies use them for entry decisions. They omit intrabar highs and lows, so use candlestick or OHLC charts when you need that detail.
Both show open, high, low, and close for each period. Bar charts use a vertical line with small horizontal ticks for open and close, while candlestick charts use a body (filled rectangle) that makes the open-to-close range visually clearer and faster to read.
One-minute and five-minute charts are options for scalping, but no timeframe suits every strategy. In spot forex, custom tick bars generally count quote updates from the broker’s feed, not centralized exchange trades. Standard MT5 timeframes remain time-based.
Heikin Ashi can help you study intraday trends, but its calculated prices can differ from current market quotes and its signals can lag. Check ordinary candlesticks and bid and ask prices before placing entries, stop-losses, or take-profits.
Charts are part of technical analysis, and some traders combine them with economic data to plan entries and exits. Professional approaches vary. Using the same chart as a professional does not reproduce their strategy, risk controls, or results.
MetaTrader 5 supports candlestick, bar (OHLC), and line charts natively. You can switch between them from the chart toolbar or keyboard shortcuts, and choose from 21 predefined timeframes. Non-standard chart constructions require additional tools.
Sources and further reading
For platform details, see MetaQuotes’ MT5 chart guide and chart settings documentation. For calculated chart prices, see TradingView’s Heikin Ashi explanation and Renko explanation. Broker conditions were checked on 7 October 2026 and may change.