


Stock chart patterns are recurring shapes formed by price movements on stock charts that signal potential continuation or reversal of trends. Traders use them with volume and indicators to plan entries, stops and profit targets, turning historical price behavior into actionable trading decisions.
Key Takeaways
- Stock chart patterns visually represent market psychology, showing whether buyers or sellers dominate.
- They are divided into reversal, continuation, and bilateral patterns.
- Recognizing these patterns helps traders identify entry and exit points with higher precision.
- Combining pattern recognition with volume confirmation improves reliability.
- Platforms like MetaTrader 5 make it easy to analyze these patterns effectively.
- Defcofx enhances such strategies with high leverage up to 1:2000, low spreads from 0.3 pips, and no commissions or swap fees, giving traders the flexibility to act swiftly on chart-based signals.
What Are Stock Chart Patterns?
Stock chart patterns are graphical formations that appear when a stock’s price moves in a recognizable shape over time. These shapes reflect the ongoing battle between buyers and sellers and help traders forecast potential price movements, whether a trend will continue or reverse.
Patterns form as traders collectively react to news, sentiment, and technical levels. Over decades, these formations have proven consistent enough to guide decision-making for both short-term and long-term traders.
Why Chart Patterns Matter in Stock Trading
Chart patterns matter because they translate raw price action into readable signals, allowing traders to anticipate movements before they happen. Instead of relying on emotions or speculation, traders use these formations to plan entries, exits, and stop-loss levels based on structure, not guesswork.
By analyzing patterns, traders can:
- Predict trend reversals or continuations with better accuracy.
- Confirm trades when combined with indicators like RSI or MACD.
- Identify breakout points where volume surges and momentum builds.
- Avoid emotional trading, since the chart offers visual evidence of sentiment shifts.
Notice
Chart patterns work best when confirmed with trading volume and complemented by clear risk management rules. A breakout accompanied by strong volume is more reliable than one occurring in silence.
Moreover, these same principles apply not only to stock markets but also to CFD and forex trading, where patterns behave similarly. Platforms like MetaTrader 5 (available with Defcofx) allow traders to easily draw, identify, and validate these chart setups using built-in technical tools.
Types of Stock Chart Patterns
Stock chart patterns are generally categorized into three main types: reversal, continuation, and bilateral (neutral). Each category signals a different kind of market behavior and requires unique confirmation methods before taking a trade.
1. Reversal Patterns
Reversal patterns signal that the current market trend is losing strength and may soon turn in the opposite direction.
Common Reversal Patterns:
- Head and Shoulders: Predicts a bullish-to-bearish reversal after three peaks, with the middle one highest.
- Inverse Head and Shoulders: Indicates a bearish-to-bullish reversal after three troughs, with the middle one lowest.
- Double Top and Double Bottom: Show exhaustion in current momentum, often followed by sharp directional shifts.
How to confirm: Use volume spikes and neckline breakouts as confirmation.
2. Continuation Patterns
Continuation patterns occur during pauses in an ongoing trend, hinting that the prior movement will likely resume once consolidation ends.
Common Continuation Patterns:
- Flags and Pennants: Short-term consolidation zones after strong price moves.
- Ascending / Descending Triangles: Indicate gradual buildup before breakout.
- Rectangles: Show range-bound trading before a breakout continuation.
3. Bilateral (Neutral) Patterns
Bilateral patterns can break out in either direction. Traders watch closely for confirmation before entering trades.
Examples:
- Symmetrical Triangles: Prices converge toward a point where breakouts can occur upward or downward.
- Wedges: Indicate decreasing momentum; breakout direction depends on prevailing market strength.
6 Most Common Stock Chart Patterns (With Examples)
Certain chart patterns appear so frequently that they’ve become staples of technical analysis. These common stock chart patterns provide traders with reliable setups to anticipate potential market moves.
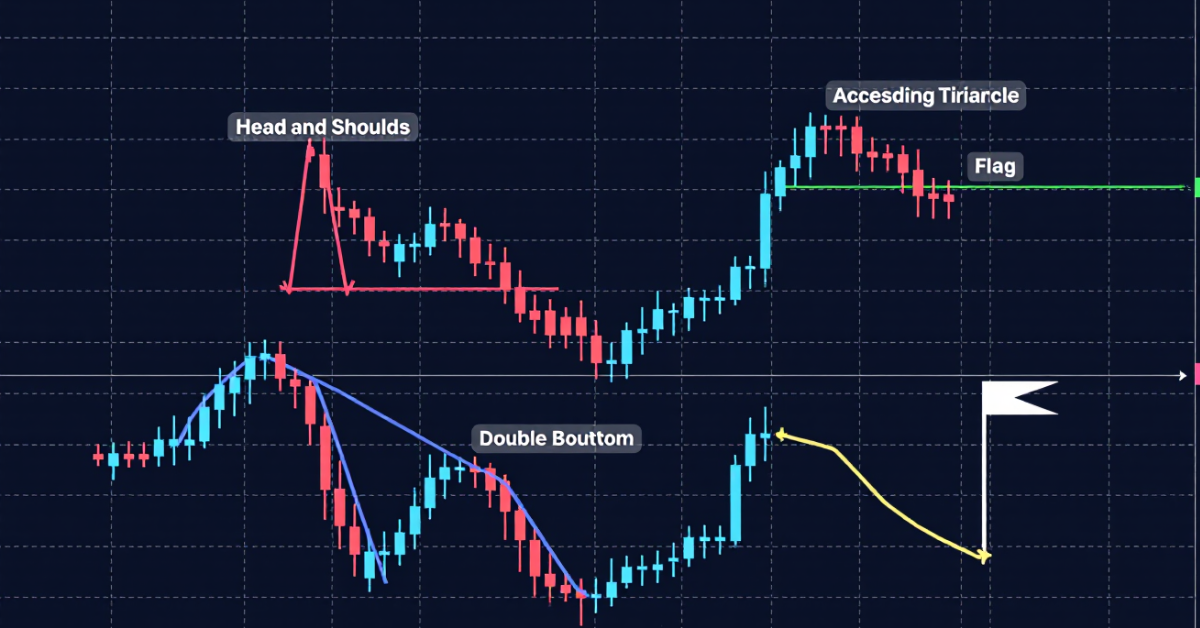
Head and Shoulders
A classic reversal pattern signaling a shift from an uptrend to a downtrend. It features three peaks, with the middle one (the “head”) higher than the others.
- Trade tip: Watch for a break below the “neckline” with rising volume for confirmation.
Double Bottom
A bullish reversal pattern that forms after a strong downtrend. The two consecutive lows show that selling pressure is weakening.
- Trade tip: Enter after the neckline breakout, placing stops just below the second low.
Ascending Triangle
A continuation pattern in an uptrend where highs align horizontally and lows rise steadily.
- Trade tip: Breakout above resistance usually signals strong bullish momentum.
Flag and Pennant
These short-term continuation patterns form after sharp moves. The market consolidates in a small flag or pennant before resuming its previous trend.
- Trade tip: Measure the “flagpole” height to estimate the breakout target.
Cup and Handle
A bullish continuation pattern resembling a cup with a small pullback (handle). Often signals trend continuation after consolidation.
- Trade tip: Enter when price breaks above the handle resistance with increasing volume.
Falling Wedge
A bullish reversal pattern that forms when the market consolidates downward with narrowing price ranges.
- Trade tip: Wait for a confirmed breakout above the wedge boundary.
How to Read Stock Chart Patterns (Step-by-Step)
Reading chart patterns correctly is crucial for turning analysis into profitable trading decisions. Here’s a simple framework traders follow to interpret them accurately:
Step 1: Identify the Trend
Before looking for a pattern, determine whether the market is in an uptrend, downtrend, or sideways phase. Patterns are only meaningful when you know the prior trend, for example, a head and shoulders loses meaning if no clear uptrend preceded it.
Step 2: Spot the Pattern Formation
Look for recognizable shapes such as triangles, flags, or double tops. Use trendlines to connect highs and lows, confirming the pattern’s symmetry and boundaries.
Step 3: Confirm with Volume Indicators
Volume should increase at breakout points to validate the pattern’s reliability. A price breakout with low volume often leads to false signals.
Step 4: Plan Entry, Stop-Loss, and Take-Profit
Use the pattern’s structure to define:
- Entry point: Right after breakout confirmation.
- Stop-loss: Just outside the pattern boundary.
- Take-profit: Equal to the pattern’s measured height or flagpole projection.
Trading Strategies Using Stock Chart Patterns
Once traders learn to identify and read patterns, the next step is applying them within structured strategies. These methods turn technical recognition into real trading opportunities.
1. Breakout Trading Strategy
Traders enter a position right after the breakout from a chart pattern such as triangles, flags, or head and shoulders when volume confirms the move.
How it works:
- Enter after candle closes beyond the breakout line.
- Set a stop-loss just below the pattern boundary.
- Target price = height of the pattern projected from breakout point.
Example: A breakout from an ascending triangle indicates buyers overpowering sellers traders go long as price pierces resistance.
2. Pullback (Retest) Strategy
Instead of entering immediately on breakout, traders wait for a retest of the breakout level to confirm support or resistance.
Advantages:
- Reduces false breakout risk.
- Offers better entry with lower stop-loss distance.
3. Trend Continuation Strategy
Used with flags, pennants, or wedges, this approach rides the trend after consolidation.
Steps:
- Identify an existing trend.
- Wait for a short-term consolidation.
- Enter after breakout with volume confirmation.
4. Multi-Timeframe Strategy
Cross-check chart patterns across different timeframes (e.g., daily + 4-hour charts).
- Confirm patterns on higher timeframes.
- Execute entries on lower timeframes for precision.
This improves accuracy and filters out false signals.
Open Live Account5 Mistakes to Avoid When Trading Chart Patterns
Even skilled traders can misinterpret patterns or enter trades too early. Avoiding these common mistakes can significantly improve your trading accuracy and protect your capital.
1. Entering Without Confirmation
Jumping into a trade before the breakout is confirmed often leads to losses.
Solution: Always wait for a candle close beyond the breakout line and confirm with volume expansion before entering.
2. Ignoring the Broader Market Context
Chart patterns alone can mislead if you ignore market sentiment or macro events.
Solution: Combine pattern analysis with trend direction, support/resistance zones, and economic data to validate the trade idea.
3. Misidentifying Patterns
Beginners often mistake random price action for patterns especially during volatile sessions.
Solution: Practice identifying patterns on historical charts using demo accounts before trading live capital.
4. Risking Too Much Leverage
Leverage magnifies both profits and losses. Misuse can lead to rapid account depletion.
Solution: Use Defcofx up to 1:2000 leverage strategically always calculate risk per trade and apply stop-loss orders.
5. Ignoring Timeframes
A pattern on a 5-minute chart may have no meaning in a daily trend.
Solution: Always cross-check formations on multiple timeframes to confirm consistency and strength.
Final Takeaways on Stock Chart Patterns
Stock chart patterns are more than just visual formations, they’re a window into market psychology. By studying these recurring shapes, traders can better anticipate potential reversals, continuations, or breakouts with improved confidence. Whether it’s identifying a head and shoulders or spotting a bullish flag, the key lies in combining pattern recognition with volume confirmation and disciplined risk management.
Incorporating these insights into your trading strategy helps transform raw price action into well-timed decisions. And with advanced tools on MetaTrader 5, powered by Defcofx, you can analyze, test, and act on chart patterns efficiently, all with ultra-low spreads, no commissions, and leverage up to 1:2000.
Ready to turn your technical analysis into real opportunities?
Open a Trading Live AccountFAQs About Stock Chart Patterns
Stock chart patterns are recurring formations created by price movements over time. They help traders predict whether a trend will continue or reverse. Patterns like head and shoulders, triangles, and flags are among the most commonly used by technical analysts.
While highly useful, chart patterns aren’t 100% accurate. Their reliability improves when confirmed with volume analysis, trend direction, and technical indicators such as RSI or MACD. Using proper risk management is always essential.
Beginners should start with simple and clear patterns such as:
1. Double tops/bottoms
2. Head and shoulders
3. Triangles
Yes. Short-term traders often rely on chart patterns like flags, pennants, and wedges on smaller timeframes (5-min, 15-min). However, confirmation with volume and trend direction is crucial to avoid false breakouts.
You can analyze them using platforms like MetaTrader 5 (MT5) or TradingView. MT5, offered free by Defcofx, provides advanced charting tools, drawing options, and real-time data for quick pattern recognition.
Defcofx Forex Articles You Shouldn’t Miss
Discover powerful forex strategies in these top reads from Defcofx.