


Price action is a trading method that analyzes raw price movements on a chart without relying on indicators to understand market behavior and make trading decisions. Traders study patterns, trends, and key levels like support and resistance to predict future price direction across markets such as forex, stocks, and crypto.
Key Takeaways
- Price action is a trading approach focused purely on price movement, without relying on indicators.
- It helps traders understand market behavior through patterns, trends, and key levels like support and resistance.
- Price action works across all markets, including forex, stocks, and cryptocurrencies.
- Traders use it to identify entry and exit points based on real-time market structure.
- It is considered a simple yet powerful method, especially useful for both beginners and experienced traders.
What Is Price Action Trading?
Price action trading is a method where traders make decisions by analyzing the movement of price on a chart, rather than relying on technical indicators or complex tools. It focuses on understanding how price behaves over time and using that behavior to anticipate future market direction.
At its core, price action trading is based on a simple idea: price reflects everything happening in the market. Instead of interpreting signals from indicators, traders observe how price reacts at key levels, how trends develop, and how patterns form. This makes it a more direct way to read market activity.
For example, when price repeatedly fails to move above a certain level, traders may interpret this as strong resistance. Similarly, consistent higher highs and higher lows indicate an uptrend. These observations help traders decide when to enter or exit trades.
Due to its simplicity and flexibility, price action trading is widely used in markets like forex, stocks, and cryptocurrencies. It allows traders to develop a deeper understanding of market structure while keeping their analysis clean and focused.
How Price Action Works (Market Logic Explained)
Price action works by reflecting the ongoing battle between buyers and sellers in the market. Every price movement you see on a chart is the result of supply and demand shifting in real time. When buyers are stronger, price moves up; when sellers dominate, price moves down.
At a deeper level, price action is driven by market psychology. Traders react to news, expectations, and key price levels, and these reactions create recognizable patterns. For example, when price reaches a level where it previously reversed, many traders anticipate a similar reaction causing price to either bounce or break with momentum.
Another important idea is that price discounts everything. This means all available information, economic data, news, and trader sentiment is already reflected in the price. Instead of analyzing multiple external factors, price action traders focus only on the chart itself.
Candlesticks play a major role here. Each candle shows how price moved within a specific time frame, revealing:
- Who was in control (buyers or sellers)
- How strong the movement was
- Whether momentum is continuing or weakening
Core Components of Price Action
To understand price action effectively, traders focus on a few fundamental components that explain how the market behaves. These elements help interpret chart movements and form the basis of most price action strategies.
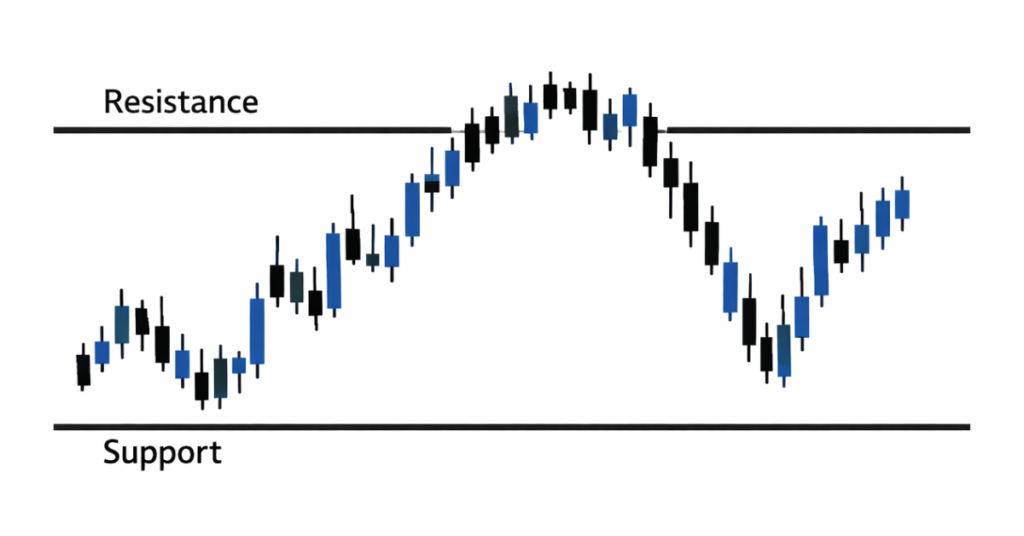
Support and Resistance
Support and resistance are key horizontal levels where price tends to react. Support represents a zone where buying interest is strong enough to prevent price from falling further, while resistance is where selling pressure can stop price from rising. Traders watch these levels closely because price often reverses or breaks through them with momentum.
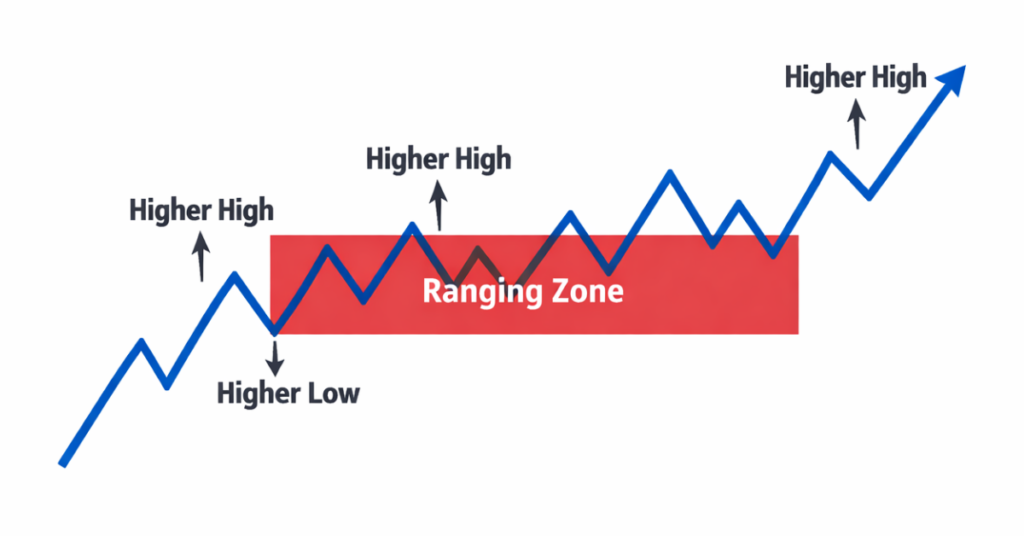
Market Trends
Price action is heavily influenced by trends. An uptrend consists of higher highs and higher lows, while a downtrend consists of lower highs and lower lows. When price moves sideways, it is considered a range or consolidation phase. Identifying the trend helps traders align their decisions with the dominant market direction.
Candlestick Behavior
Candlesticks provide insight into how price moves within a specific time period. Each candle shows the open, high, low, and close, revealing whether buyers or sellers were in control. Patterns formed by candlesticks can indicate potential reversals or continuation of trends.
Breakouts and Rejections
Breakouts occur when price moves beyond a key level such as support or resistance with strong momentum. Rejections happen when price tests a level but fails to break it and moves in the opposite direction. Both scenarios are important signals in price action trading, as they often indicate shifts in market sentiment.
Common Price Action Patterns (With Explanation)
Price action patterns are recurring chart formations that help traders interpret market behavior and anticipate potential reversals or continuations. While no pattern guarantees outcomes, they provide valuable insight when used alongside market structure and key levels.
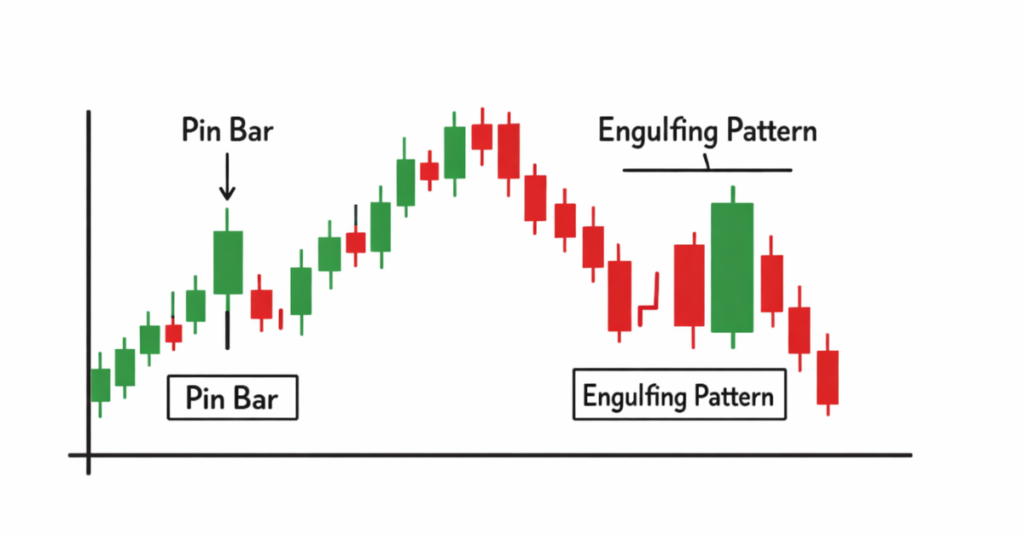
Pin Bar
A pin bar has a small body with a long wick, showing that price was rejected from a certain level. The long wick represents a strong rejection by buyers or sellers. Traders often watch pin bars near support or resistance as they can signal a possible reversal.
- Indicates rejection of a price level
- Common near support/resistance zones
- Can signal reversals when confirmed
Engulfing Pattern
An engulfing pattern occurs when a larger candle completely covers the previous candle. It reflects a shift in momentum, where one side of the market (buyers or sellers) takes control.
- Bullish engulfing → buyers dominate
- Bearish engulfing → sellers dominate
- Often signals reversals or continuation depending on context
Inside Bar
An inside bar forms when a candle is completely contained within the range of the previous candle. It represents consolidation and indecision in the market.
- Indicates market consolidation
- Often followed by a breakout
- Used to anticipate volatility expansion
Breakout Patterns
Breakouts occur when price moves beyond a significant level such as support or resistance. This movement often indicates strong momentum and the potential start of a new trend.
- Signals increased volatility
- Can mark the beginning of new trends
- Requires confirmation to avoid false breakouts
How to Trade Using Price Action (Step-by-Step)
Trading using price action involves analyzing the chart, identifying key levels, and making decisions based on how price behaves around those levels. Instead of relying on indicators, traders focus on structure, patterns, and momentum to plan entries and exits.
Step 1: Analyze the Market Structure
Begin by identifying whether the market is trending or ranging. Look for higher highs and higher lows in an uptrend, or lower highs and lower lows in a downtrend. This gives you a directional bias before taking any trade.
Step 2: Identify Key Levels
Mark important areas such as support and resistance on your chart. These levels are where price has previously reacted and are likely to influence future movement again.
Step 3: Wait for Price Reaction
Avoid entering trades immediately at key levels. Instead, observe how price behaves when it reaches those zones. Look for rejection wicks, strong candles, or consolidation.
Step 4: Confirm the Setup
Confirmation comes when price action aligns with your analysis. For example, a bullish engulfing candle at support during an uptrend may indicate buying strength.
Step 5: Execute the Trade and Manage Risk
Once confirmed, execute the trade with a defined plan. Always set stop-loss and take-profit levels based on market structure.
Price Action vs Indicators (Clear Comparison)
Price action and technical indicators are two different approaches used in trading, but they serve the same purpose: helping traders analyze the market and make informed decisions. The main difference lies in how the analysis is conducted.
Price action focuses on raw price movement, meaning traders rely directly on the chart without adding extra tools. They interpret candlestick patterns, trends, support and resistance levels, and market structure to understand what is happening in real time. This approach is considered more direct because it reflects the actual behavior of buyers and sellers.
In contrast, indicators are mathematical calculations based on past price data. Tools such as moving averages, RSI, and MACD are used to generate signals that help traders identify trends, momentum, or potential reversals. While indicators can be useful, they often lag behind price because they are derived from historical data.
Key Differences Between Price Action and Indicators
| Aspect | Price Action | Indicators |
| Data Source | Raw price movement | Derived from past price data |
| Complexity | Simple and visual | Requires interpretation of signals |
| Lag | Real-time | Often lagging |
| Tools Needed | None | Indicators required |
| Focus | Market structure & behavior | Mathematical signals |
Which One Is Better?
There is no universal answer. Price action is often favored by traders who prefer simplicity and direct analysis, while indicators are helpful for those who want additional confirmation or structured signals. Some traders even combine both approaches to strengthen their strategies.
Is Price Action Trading Profitable?
Price action trading can be profitable, but its success depends on a trader’s skill, discipline, and ability to interpret the market correctly. Since it relies on analyzing raw price movement, traders must develop a strong understanding of market structure, patterns, and behavior over time.
Unlike systems that depend heavily on indicators, price action does not provide automatic signals. Instead, traders must make decisions based on observation and experience. This makes it a flexible approach, but also one that requires practice and consistency to master.
Profitability in price action trading is not guaranteed by the method itself, but by how well it is applied. Traders who combine price action with proper risk management, patience, and a clear trading plan are more likely to achieve consistent results.
Key Factors That Influence Results
- Understanding of market structure and trends
- Ability to identify high-probability setups
- Consistency in applying a trading plan
- Proper risk-to-reward management
- Emotional discipline during winning and losing trades
Best Market Conditions for Price Action
Price action trading works best when the market provides clear structure and predictable behavior. Certain environments make it easier to identify setups, while others can produce noise and false signals. Understanding these conditions helps traders focus on higher-quality opportunities.
- Trending markets are generally the most favorable for price action. In an uptrend, price forms higher highs and higher lows, while in a downtrend, it forms lower highs and lower lows. These patterns allow traders to align with the dominant direction and look for continuation setups after pullbacks to key levels.
- Ranging (sideways) markets occur when price moves between well-defined support and resistance zones without a clear trend. In these conditions, traders often look for reversals near the boundaries of the range or prepare for potential breakouts when price exits the consolidation phase.
- Volatile markets can create strong and rapid price movements. While this increases the potential for quick opportunities, it also introduces uncertainty, as price may spike, reverse sharply, or break levels without sustained movement.
Choosing the Right Trading Conditions
While price action itself is independent of any platform or broker, the trading environment can influence how effectively strategies are executed. Factors such as spreads, execution speed, and order reliability can impact trade outcomes, especially for traders who rely on precise entries and exits.
- Trading conditions that offer tight spreads starting from 0.3 pips can help reduce trading costs, which is particularly useful for strategies that involve frequent entries and exits.
- Platforms that provide high leverage options up to 1:2000 allow traders greater flexibility in position sizing, especially when managing capital across multiple setups.
- Fast support and withdrawals (within 4 business hours) contribute to a smoother overall trading experience, ensuring traders can access their funds efficiently when needed.
- Global accessibility and multi-language support ensure traders from different regions can participate in the market without unnecessary limitations.
- Trading environments with no commissions or swap fees help keep costs transparent and predictable, which is beneficial for long-term strategy planning.
FAQs
Price action is a trading method that analyzes how price moves on a chart to make decisions. It focuses on raw price movement rather than using technical indicators, helping traders understand market behavior directly.
Price action trading works by observing patterns, trends, and key levels such as support and resistance. Traders use candlestick behavior and market structure to identify potential entry and exit points based on how price reacts in real time.
Yes, price action is suitable for beginners because it relies on clean charts and straightforward concepts. However, it requires practice and patience to learn how to correctly interpret market structure and price behavior.
Yes, price action trading does not require indicators. Traders rely solely on price charts, candlesticks, and structural elements to analyze the market and make trading decisions without lagging signals.
There is no single “best” strategy. Common approaches include trend trading, breakout trading, and range trading. The effectiveness of any strategy depends on how well it is applied along with proper risk management and market understanding.
Neither is universally better. Price action offers a cleaner and more direct view of the market, while indicators can provide additional confirmation. Many traders prefer price action for its simplicity, while others combine both methods for more comprehensive analysis.
Final Thoughts on Price Action Trading
Price action trading is a straightforward yet powerful approach that focuses on analyzing raw market movements rather than relying on indicators. By studying price behavior, market structure, and key levels such as support and resistance, traders can develop a clearer understanding of how the market operates and make more informed decisions.
The effectiveness of price action lies in its simplicity and adaptability. It can be applied across different markets, including forex, stocks, and cryptocurrencies, and works in various market conditions when used with proper analysis and patience. However, success depends on consistent practice, discipline, and the ability to interpret charts accurately over time.
Open a Live Trading Account