


A MetaTrader 4 support and resistance indicator automatically detects and plots key price zones where an asset tends to stall or reverse, saving traders time and reducing subjectivity. It helps identify potential entry and exit levels, making technical analysis easier and more consistent without manually drawing lines.
Key Takeaways
- A support/resistance indicator adds objectivity by auto-marking zones based on past price action.
- It works across multiple timeframes, from H1 up to daily/weekly, giving flexibility for different trading styles.
- The indicator can speed up analysis, helping traders spot optimal buy/sell or stop-loss/take-profit zones quickly.
- Using support/resistance zones effectively requires confirmation (price action, trend context), not blind reliance.
- Even with an indicator, the market can “break through” zones, so risk management remains essential.
What Are Support & Resistance (Trading Basics)
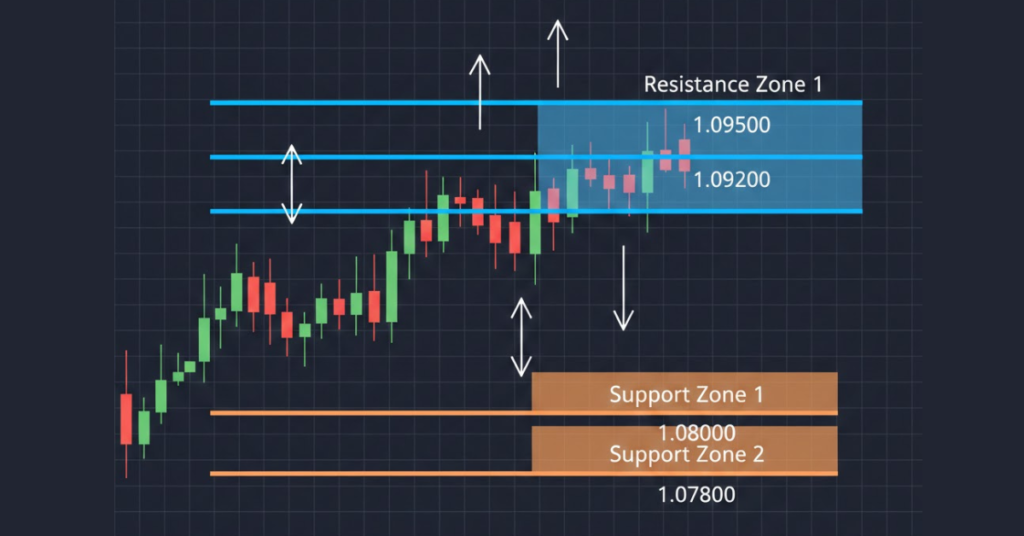
Support and resistance are foundational concepts in chart-based trading and technical analysis. Support refers to a price level (or zone) where demand tends to increase, preventing price from falling further, acting like a “floor.”
Conversely, resistance is a level where selling pressure or supply tends to dominate, preventing the price from rising further, functioning like a “ceiling.”
Because support and resistance emerge from the interplay of supply and demand and often trader psychology, they tend to shape where price reversals, bounces, or pauses may occur.
Investors and traders watch these levels because they can indicate potential entry or exit points: when price approaches support, it may bounce upward (buy opportunity); when it nears resistance, it may reverse downward (sell or short opportunity).
One key nuance: support and resistance aren’t always exact lines. Often they’re better thought of as zones because price may test or slightly breach a level, then reverse.
This means traders should treat these levels as areas of interest, not precise “buy/sell at exactly this number.”
Why Use a Support & Resistance Indicator on MT4 (vs Manual Drawing)
Using a support & resistance (S/R) indicator on MetaTrader 4 (MT4) instead of drawing levels manually offers several clear advantages that help traders save time, increase consistency, and reduce subjectivity.
Removes Subjectivity and Bias
Manual drawing of support/resistance levels depends heavily on a trader’s interpretation of what looks like a support zone to one may look different to another. An automated S/R indicator applies a consistent algorithm to identify swing highs/lows or clusters of price action across timeframes. This objectivity ensures that the same logic is applied chart after chart, reducing the chances of drawing arbitrary or biased lines.
Saves Time and Streamlines Analysis
Scanning charts manually especially across multiple pairs or timeframes can be time-consuming. An indicator automatically analyzes historical price data and plots potential support/resistance zones, so traders don’t waste time manually reviewing every high/low. This automation speeds up analysis and helps traders react more quickly.
Ensures Consistency Across Symbols & Timeframes
Because the indicator uses fixed rules rather than human judgment, it applies uniform criteria across different assets and timeframes. That means support/resistance zones on a EUR/USD daily chart and a GBP/JPY H1 chart are identified the same way, improving consistency in your trading approach.
Provides Visual Clarity and Reduces Chart Clutter
Good S/R indicators for MT4 often visualize levels as zones (not just single lines), and may color-code support vs resistance. This helps traders immediately see where key levels lie without cluttering the chart with many manual lines.
Helps Detect Both Major and Minor Levels (Multi-Timeframe Analysis)
Many S/R indicators can display zones from multiple timeframes (e.g. H4, Daily, Weekly) at once. This lets traders see both long-term major levels and shorter-term ones on the same chart, a big advantage over drawing manually, which is often limited to what you visually scan.
Supports Risk Management and Trade Planning
With clearly drawn zones, traders can more confidently plan entries, exits, stop-loss, and take-profit levels. For example, buying near support with a stop-loss slightly below or placing a take-profit near resistance. This structure improves discipline and risk control compared to guesswork.
Reduces the Chance of Missing Key Levels
Because the indicator analyzes historical data systematically, it’s less likely to miss important levels, especially on less-watched timeframes or less familiar currency pairs. Manually, it’s easy to overlook subtle yet important swing highs/lows or zones where price has bounced frequently.
When Indicator Is Preferable Over Manual Drawing, Typical Use Cases
- When you’re monitoring multiple currency pairs or markets and don’t have time for drawing each manually.
- When you want consistent technical analysis across different timeframes (trend analysis + short-term entries).
- If you are new to trading and haven’t yet developed the skill or discipline to correctly draw support/resistance manually.
- When you need fast decisions, such as in intraday or swing trading, the indicator speeds up level detection.
- When combining S/R with other tools (e.g., trend analysis, oscillators, risk management), visual zones help integrate multiple strategies more clearly.
How MT4 Support & Resistance Indicators Work: Mechanics & Features
A support & resistance indicator on MetaTrader 4 (MT4) automates the process of detecting key price levels where markets previously reversed or paused. Instead of manually trying to guess where support and resistance lie, the indicator uses price history (swing highs/lows, past reactions) to identify, compute, and plot these zones.
Core Mechanism
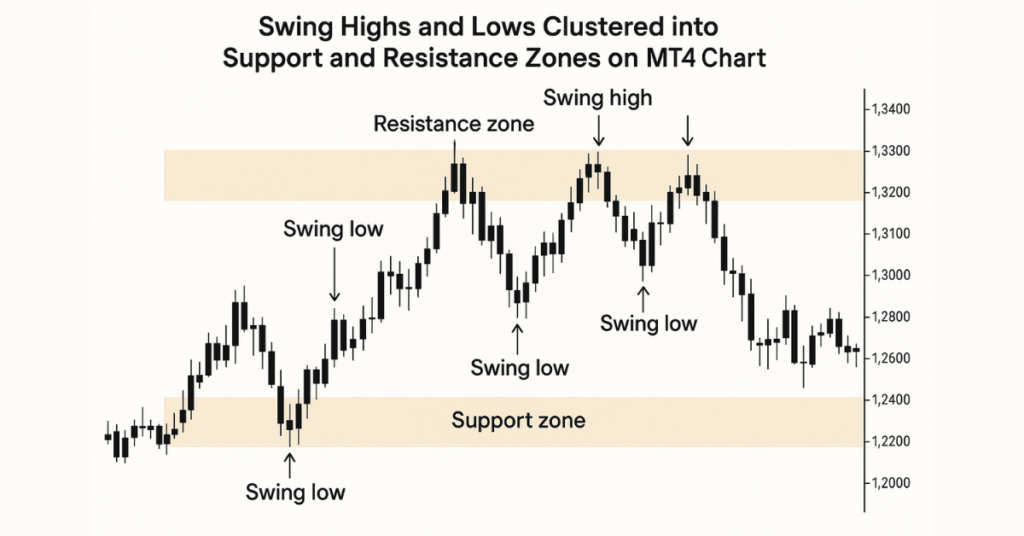
- Swing-point detection: The indicator analyzes past price data to find local maxima and minima, i.e., swing highs and swing lows, which often mark where buyers or sellers previously dominated.
- Zone clustering: Instead of drawing exact horizontal lines, many indicators group nearby swing points into broader zones. This reflects real-world price behavior better, since support/resistance is rarely a single price but a range.
- Strength assessment: Some indicators assess how many times price has touched or reacted to a zone; more touches often signal stronger, more significant support/resistance.
- Multiple timeframe integration: The indicator can pull data from higher timeframes (e.g. H4, Daily, Weekly) and overlay zones onto your current chart timeframe (e.g. H1 or M15). This helps you see major long-term levels and short-term zones together.
Typical Features of a Good MT4 S/R Indicator
- Automatic plotting of support and resistance zones on the chart; no drawing required.
- Configurable sensitivity or “look-back” period: you can often choose how many bars of historical data the indicator considers to detect levels, allowing for flexibility depending on whether you trade intraday, swing, or long-term.
- Customizable visual settings: colors, line or zone width, and fill or transparency, so you can make zones clear without cluttering the chart.
- Dynamic updates: as new price action forms, the indicator recalculates levels, meaning support/resistance zones stay relevant as markets evolve.
- Alerts/notifications (in some versions): when the price approaches or breaks a zone, the indicator can alert you (on-screen, email, push, etc.), helping you act even if you’re away from the chart.
Why This MetaTrader 4 Support and Resistance Indicator Matters for Traders
With a well-implemented MT4 support & resistance indicator, traders get a chart that highlights likely price-reaction zones automatically. This simplifies technical analysis significantly. It reduces manual errors or bias in drawing lines, helps maintain consistency across different currency pairs or instruments, and supports multi-timeframe strategies by overlaying major and minor levels together.
Because zones are presented as areas, not exact lines, the indicator offers a realistic view of where price may hesitate, bounce, or break out. That helps traders plan entries, exits, stop-losses, and take-profits more systematically, rather than guessing where support/resistance might be.
How to Download, Install & Activate the Indicator in MT4
Step 1: Find a Reliable Source
Only download support & resistance indicators from platforms that provide clear documentation, version history, and reputable distribution. Here are trusted sources where traders commonly download MT4 support/resistance indicators:
MT4 (Support & Resistance indicator downloads)
- MQL5 Code Base (free MT4 indicators) – example: “Support and Resistance MT4” (free download) MQL5
- EarnForex (free indicator download + documentation) – “Support and Resistance Lines” for MT4/MT5 Earn Forex
- MT4Collection (free MT4 support/resistance indicators) – “Support and Resistance” download page MT4 Collection
- FXSSI (free S&R indicator download for MT4/MT5) FXSSI – Forex Sentiment Board
MT5 (Support & Resistance indicator downloads)
- MQL5 Market / Marketplace (verified MT5/MT4 products + updates) MQL5
Tip: Prefer indicators that do not require external DLL files unless the developer is well-known and you fully trust the source.
Step 2: Download the Indicator
- Download the indicator file (usually a .mq4 or .ex4 file for MT4).
- If it comes in a .zip/.rar, extract it using WinRAR or 7-Zip.
- Ensure you have the main indicator file and any included documentation.
Step 3: Install the Indicator in MT4 (Step-by-Step)
- Open MetaTrader 4
- Go to File → Open Data Folder
- Navigate to: MQL4 → Indicators
- Copy the indicator file (.mq4 or .ex4) into that folder
- Restart MT4, or open Navigator (Ctrl+N) → right-click Indicators → Refresh
- Apply it to a chart: Insert → Indicators → Custom → (Your Indicator Name)
- Adjust settings (look-back period, zone width/sensitivity, colors) → click OK
Common Issues & Quick Fixes
- Indicator doesn’t appear: It’s usually in the wrong folder. Always use File → Open Data Folder, not Program Files.
- Nothing shows on the chart: Switch timeframe, scroll left to load history, or increase the look-back period.
- DLL warning: Avoid unknown DLL-based indicators unless you trust the developer/source.
How to Use the Indicator (Practical Strategy Tips)
Using an MT4 support and resistance indicator effectively means combining what it shows with smart analysis, confirmation signals, and risk‑management discipline.
Here’s how to get the most out of it.
Strategy Tips for Better Results
When the indicator draws support/resistance zones on your chart, treat them as areas of interest, not guarantees. A good approach is:
- Use multiple timeframes to validate zones. For example, identify major zones on a daily or 4‑hour chart, then zoom into 1‑hour or 15‑minute charts to fine‑tune entries.
- Wait for confirmation before entering a trade. Good confirmation signals include price action such as rejection candles (e.g., long‑wicked candles, pin bars, engulfing patterns), increased trading volume, or supportive momentum via other indicators (like RSI, MACD).
- Define clear stop‑loss and take‑profit levels relative to zones: for a buy near support, set stop‑loss just below the zone and take‑profit near the next resistance zone (or vice versa for shorts).
- Use confluence, combining support/resistance zones with other tools (trend lines, moving averages, Fibonacci retracement, pivot levels) to increase the probability of success.
When to Use, Best‑Fit Use Cases
This indicator and strategy tend to work best when:
- The market is trending or oscillating within a range of zones from higher timeframes that tend to hold better in those conditions.
- You’re trading multiple pairs or multiple timeframes and need consistent, automated zone detection.
- You want a baseline for planning trade entries, exits, and stop-loss/take-profit that’s more structured and less guesswork than drawing manually.
- You combine the zones with other analysis (price action, volume, etc.) to avoid “blind” trading based solely on zones.
What to Watch Out For: Limitations & Risk Management
Even with a good indicator and clear zones, there are no certainties.
- Zones may fail: price can break support or resistance, especially during high volatility or major news events. That’s why confirmation and stop‑loss are essential.
- Over-reliance: depending only on zones without checking trend context, volume, or momentum can lead to false signals.
- “Zone clutter”: multiple timeframes may produce many overlapping zones, which can confuse more than help. Avoid overloading charts.
More structured trade setups have clear entry, exit, stop‑loss, and take‑profit zones.
Less guesswork and bias compared to manually drawn levels.
Better multi‑timeframe perspective, seeing both long‑term major zones and short‑term entries together.
A disciplined framework for risk management and trade planning.
What the Indicator Can’t Guarantee (Limitations & Risks)

A support and resistance indicator on MetaTrader 4 (MT4) helps mark zones based on past price action, but that does not mean those zones will always hold. Market conditions constantly change. Even levels that historically acted as strong support or resistance can fail to produce a bounce or rejection.
Large volatility, unexpected news, and macroeconomic events can make prices ignore previously reliable zones. In such cases, the indicator’s zones may become irrelevant or even misleading.
Even with historical zones, traders can experience false breakouts where price temporarily breaches a zone only to reverse back. These false signals can trigger premature entries or exits, causing losses if not managed carefully.
Because most support/resistance tools rely on historical data, they cannot foresee sudden shifts in market sentiment, fundamentals, or external events. In such scenarios, the past is no guarantee for the future.
Another challenge: different traders (or even different indicators) may mark support/resistance zones differently. What appears as a strong support for one may be ignored by another. This subjectivity means the same indicator can produce varying results depending on settings and interpretation.
Because of these uncertainties, relying solely on a support/resistance indicator without additional confirmation (trend analysis, volume, price action, news awareness, etc.) increases risk significantly.
What You Can Do to Mitigate Risk
To reduce the impact of indicator limitations, many experienced traders:
- Use multi‑timeframe analysis to prioritize zones from higher timeframes (e.g., daily/weekly), as these tend to be more reliable than short‑term zones.
- Wait for confirmation signals such as candle‑pattern confirmations (rejection wicks, engulfing candles), volume spikes, or alignment with overall trend before acting on a bounce or breakout.
- Combine support/resistance zones with other technical tools (trend lines, moving averages, momentum indicators) or fundamental analysis to build a more holistic view.
- Always use appropriate stop‑loss and take‑profit planning: assume zones might fail, and define risk accordingly.
Who Should Use MetaTrader 4 Support And Resistance Indicator, Ideal Trader Types & Use Cases
The MT4 support & resistance indicator tends to work best for traders who value structure, consistency, and clarity in chart analysis. Long-term swing traders, day traders, or those monitoring multiple pairs often benefit, especially when they want an objective, fast way to identify key price zones without manually drawing lines each time.
Combining such indicators with other tools (trend analysis, volume, momentum) helps traders build robust setups that balance opportunity and risk.
This tool is especially suited for traders who:
- Want to use support/resistance zones as part of a disciplined trading plan.
- Trade across different timeframes from intraday to weekly and need a clear view of both major and minor levels.
- Seek to reduce subjectivity and chart‑drawing effort while still maintaining transparency in their analysis.
That said, using the indicator effectively still requires trading experience, patience, and risk management discipline.
Final Thoughts on the MetaTrader 4 Support and Resistance Indicator
Support and resistance zones, whether manually drawn or automatically plotted by an MT4 indicator, remain among the most reliable tools in technical analysis. They help frame potential entry and exit points, guide stop‑loss / take‑profit placement, and provide a clearer view of market structure.
However, these zones are not guaranteed. Because they rely on historical price data, sudden volatility, market‑moving news, or shifts in market sentiment can render them invalid. False breakouts, whipsaws, or failures to respect zones are real, so traders must remain cautious and always use confirmations (volume, price action, trend) rather than relying solely on the indicator.
Best results come when support/resistance indicators are used as part of a broader trading strategy, not as a standalone signal. Discretion, risk control, and a combination of tools tend to produce more consistent outcomes than chasing each level blindly.
Why Trade with Defcofx?
Defcofx gives traders a powerful, flexible, and transparent trading experience designed for growth. Whether you’re a new trader or an experienced one, the platform offers everything you need to trade confidently, backed by fast execution, reliable support, and global accessibility.
What Makes Defcofx Stand Out
1. High Leverage Up to 1:2000: Trade bigger positions with smaller capital. Defcofx lets you maximize your trading potential with flexible leverage options designed to match your strategy.
2. 40% Welcome Bonus on First Deposit: Start strong with a 40% bonus when you deposit at least $1000. This offer is available to all clients and gives your trading journey an instant boost.
3. Zero Commission & No Swap Fees: Enjoy low-cost trading with spreads starting from just 0.3 pips. No hidden charges, no swap fees, just clean and transparent pricing.
4. Global Trading Access: Defcofx welcomes traders from every country, offering a multilingual platform that supports a seamless trading experience worldwide.
5. Fast Support & Quick Withdrawals: Customer support is responsive, and withdrawals are processed within 4 business hours, even on weekends, so you always stay in control of your funds.
Ready to Start Trading?
Join Defcofx today and experience a powerful, transparent, and globally trusted trading environment.
Open a Live Trading AccountFAQs
A support & resistance indicator automatically scans past price data to detect swing highs and lows, clusters them into “zones,” and plots those zones on the chart. This saves traders from manually drawing lines and helps consistently identify likely price‑reaction areas.
Yes, most MT4 support/resistance indicators support all currency pairs and all timeframes, from minutes to daily/weekly charts. This makes them flexible for day trading, swing trading, or long-term analysis.
No, while the indicator helps by drawing potential support/resistance zones, these zones are based on historical price action and do not guarantee future reactions. It’s best to combine the indicator with confirmation tools (price action, volume, and trend context) and always apply good risk management.
You can often adjust how many historical bars the indicator looks back at, the “sensitivity” or threshold for defining zones, and the visual appearance (colors, zone width). Some versions also show how many times the price reacted to a zone, and may send alerts when the price approaches or breaks a zone.
Not necessarily. A breakout might be real, or it could be a “false breakout”/fake-out. External factors like volatility, news events, or market sentiment shifts can cause prices to ignore historical zones. Traders should wait for confirmation (e.g., closing beyond the zone, retest, volume confirmation) before assuming a breakout is genuine.
Defcofx Forex Articles You Shouldn’t Miss
Discover powerful forex strategies in these top reads from Defcofx.
- What Currency is The Most Valuable
- What Are Currency Controls? Definition, Types & Examples
- How Much is 0.5 Lot Size in Dollars
- Best Time To Trade NZD/USD
- What Is Considered the Greatest Risk Associated With Forex Settlement?
- Is NZD/USD a Major or Minor Pair?
- Trailing Stop Limit: Definition, Uses & Trading Guide
- When Does a Bearish Market Become Bullish in Forex?
- Is Pound Stronger than Dollar?