


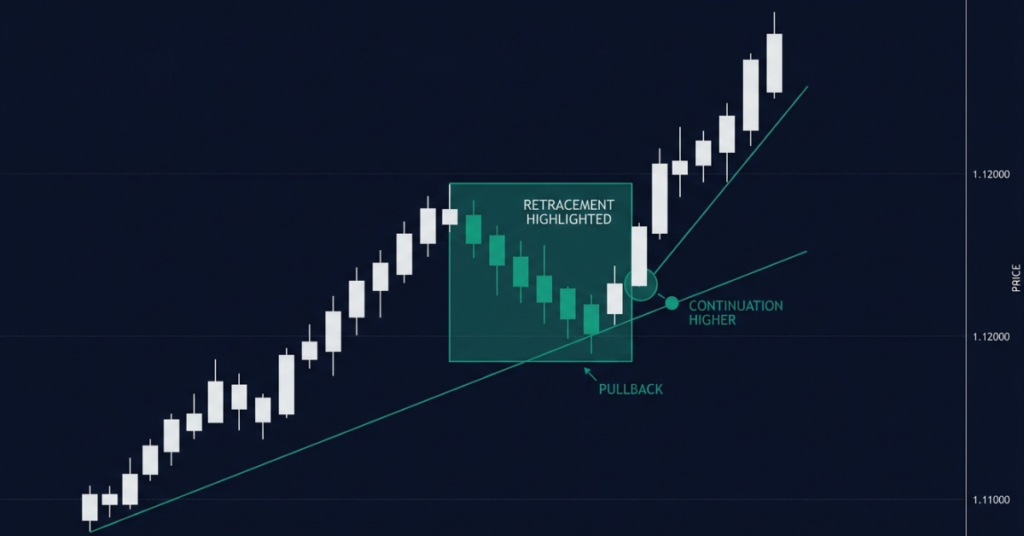
A retracement in trading is a temporary price move against an existing trend. In forex, this can be a dip during an uptrend or a bounce during a downtrend. Traders study market structure and potential support or resistance, but a developing pullback can become a reversal.
Key takeaways
- A retracement is a temporary counter-trend move, not a full trend reversal.
- Fibonacci retracement levels (23.6%, 38.2%, 50%, 61.8%, 78.6%) are a commonly used tool for identifying where a retracement may end.
- Some traders look for reduced activity during a pullback, but this is not a rule. Spot forex feeds usually show tick volume, not consolidated traded volume.
- The 61.8% retracement is derived from the reciprocal of the golden ratio and is watched as a possible support or resistance area, not a guaranteed turning point.
- Waiting for confirmation (a reversal candlestick, a break of a minor resistance level) before entering may add context, but cannot prevent false signals.
- A retracement that breaks through a key structural level becomes a potential reversal, not just a pullback.
How retracements fit into a trend
Markets rarely move in a straight line. A rising currency pair can fall for several candles before rising again, while a falling pair can temporarily rebound. Profit-taking, changing orders and new information can contribute to these moves, but a chart alone cannot establish the cause of a particular pullback.
The key word is temporary. Traders often assess an uptrend through higher highs and higher lows, and a downtrend through lower highs and lower lows. A break of an important swing level challenges that structure, but it does not automatically establish a new trend. The timeframe and swing points matter.
Retracement vs reversal: compare trend structure
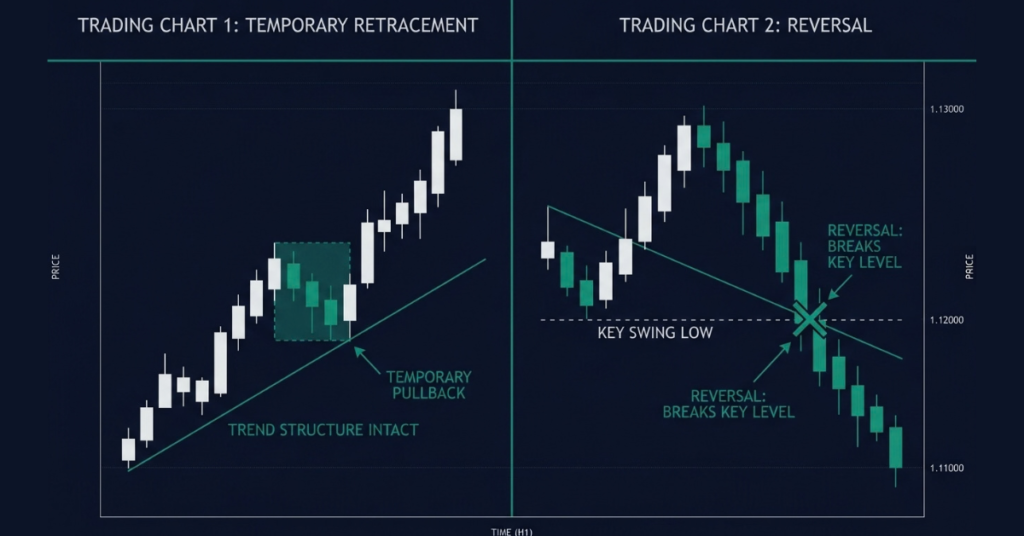
A potential retracement and an emerging reversal can look similar. The comparison below provides context, not a checklist that predicts the outcome. The illustrations show completed examples rather than a certain forecast.
| Retracement | Reversal | |
| Duration | Temporary relative to the chosen trend and timeframe | A change in trend direction on the chosen timeframe |
| Volume | May decrease, but varies | May increase, but not diagnostic |
| Trend structure | Higher lows maintained (uptrend) | An important swing break may signal a change; further structure matters |
| Fibonacci | May pause near watched levels | No single Fibonacci cutoff proves a reversal |
| Moving averages | Can cross a moving average during a pullback | A sustained shift around an average can add context, but is not proof |
| Trading approach | Consider a tested continuation setup: buying a dip or selling a bounce | Reassess the setup and risk; a swing break alone does not justify reversing |
A break of an important swing low in an uptrend, or swing high in a downtrend, can challenge the trend assumption. Crossing 61.8% alone does not prove a reversal; assess structure on the timeframe you trade.
For a deeper look at trend identification, see our article on how to use moving averages for swing trading, which covers the role of moving averages in filtering retracements.
What Fibonacci retracement levels measure
Fibonacci retracement is a charting tool that divides a selected price move into percentage levels. Traders use these as possible support or resistance areas. Several ratios relate to the Fibonacci sequence; 50% is a conventional midpoint rather than a Fibonacci ratio, and 78.6% is approximately the square root of 61.8%. None predicts a turning point.
| Fibonacci Level | Significance | Trader Interpretation |
| 23.6% | Shallow retracement | Measures a small proportion of the selected move; continuation remains uncertain |
| 38.2% | Moderate retracement | A reference area to compare with price structure, not an automatic entry |
| 50.0% | Half-way level (not a Fibonacci ratio but widely watched) | Marks half of the selected move; price may pass through it |
| 61.8% | Reciprocal of the golden ratio (approximately 0.618) | A commonly watched potential support/resistance zone |
| 78.6% | Deep retracement | A deep retracement; assess if trend structure remains intact |
Calculate a EUR/USD retracement example
Suppose EUR/USD rises from 1.10000 to 1.12000, a 200-pip move with one pip equal to 0.0001. A 50% retracement gives back 100 pips and reaches 1.11000. For a rising move, calculate each level as high − (high − low) × retracement ratio.
| Retracement from the high | EUR/USD price | Pullback in pips |
|---|---|---|
| 23.6% | 1.11528 | 47.2 |
| 38.2% | 1.11236 | 76.4 |
| 50% | 1.11000 | 100.0 |
| 61.8% | 1.10764 | 123.6 |
| 78.6% | 1.10428 | 157.2 |
For a falling move, calculate the bounce as low + (high − low) × retracement ratio. These hypothetical prices explain the calculation and are not entry recommendations. The MQL5 Fibonacci calculator explains the direction of these calculations and their limitations.
Plan a retracement trade step by step
The following is an illustrative planning process, not a proven profitable strategy. Test your rules and costs on historical data and a demo account before considering live trades.
Step 1: Assess the trend: Identify a clear uptrend or downtrend on your chosen timeframe. Use structure (higher highs and higher lows for an uptrend) and an exponential moving average (EMA), such as the 50-period EMA as a reference.
Step 2: Wait for the pullback: Do not enter at the trend high. Some traders monitor zones such as 38.2% to 61.8%, but no range is universally best. In a downtrend, look for a bounce rather than a dip.
Step 3: Look for confirmation: A reversal candlestick at the Fibonacci level (hammer, bullish engulfing, pin bar) may suggest buying interest in an uptrend; use the corresponding bearish pattern in a downtrend. A candle is not proof that the pullback has ended.
Step 4: Set your entry: Define an entry rule in advance. Examples include a candle close or a break above a signal candle’s high for longs, or below its low for shorts. Account for bid/ask prices, spreads and slippage; an apparent signal can fail.
Define exits and manage trade risk
Step 5: Place your stop loss: For a long position, consider a stop below the structural low that invalidates your setup; for a short position, above the relevant swing high. Allow for volatility, spread and possible slippage, and size the position from the planned loss. A Fibonacci level alone is not a universal stop location.
Step 6: Set your take profit: For longs, the prior swing high is one possible target; for shorts, the prior swing low. A reward-to-risk target such as 2:1 is illustrative, not a guarantee of profitability, and must be assessed alongside win rate and costs.
For a comparison of holding periods and trading styles, read our article on scalp trading vs swing trading, which compares scalping with swing trading.
Open a Demo AccountStudy retracements on Defcofx MT5
On MT5 desktop, select Insert > Objects > Fibonacci > Retracement, then click and drag between your chosen swing points. Check the resulting price levels and anchor direction. Object properties let you edit levels, including adding 0.786 for 78.6%. See the official MetaTrader 5 instructions for drawing and settings.
MT5 also provides candlestick charts, RSI and moving averages. These tools help describe price behaviour; they do not guarantee reliable entries. Defcofx’s account overview lists Silver and Gold accounts with different deposit and leverage conditions. Confirm current terms and instrument specifications before funding.
Review Defcofx account terms before funding
| Feature | Defcofx Offer |
| Spreads | From 0.5 pips |
| Leverage | Up to 1:2000 on Silver and 1:500 on Gold; instrument limits apply |
| Commissions | Zero |
| Swap Fees | Zero |
| Welcome Bonus | 40% trading credit for eligible new clients’ first deposit of at least USD 1,000 or EUR 1,000. Request and receive it before trading; verification and country exclusions apply. Bonus credit is not withdrawable. |
| Withdrawals | Typically around 3 hours; withdrawal eligibility and processing conditions apply |
| Platform | MetaTrader 5 (MT5) |
| Account Types | Silver and Gold live accounts; demo accounts available |
Practise spotting potential retracements with virtual funds. Open a free Defcofx demo account and apply the Fibonacci tool in a simulated trading environment. Demo execution and the experience of losses can differ from live trading.
Ready to trade retracements live? Open a live account on Defcofx after checking local eligibility and understanding leverage and potential losses. Review the full bonus conditions; withdrawals and internal transfers cancel bonus credit.
Open a Live AccountManage uncertainty before trading a pullback
Retracements are a normal part of trending markets, but identifying one correctly requires more than spotting a temporary pullback. The combination of market structure, Fibonacci levels, volume, and price-action confirmation can help traders distinguish a potential continuation from a move that may be developing into a reversal.
Assess market structure and a predefined entry rule rather than treating a Fibonacci level as a trade instruction. No confirmation signal removes uncertainty. Practising this process on a demo account can help you understand how retracements behave across different timeframes and markets before applying the strategy with real capital.
Common questions about trading retracements
You cannot know with certainty as a pullback unfolds. Watch relevant swing structure, momentum and support or resistance on your chosen timeframe. An important swing break can challenge the trend, but no Fibonacci percentage proves a reversal.
There is no universally best timeframe. Choose one that matches your holding period and tested rules. A higher timeframe can add context, but it does not make Fibonacci signals reliable or guarantee better entries on a lower chart.
You can apply the tool to forex, stocks, commodities and crypto charts. Its mathematical levels do not establish a profitable edge in any market. Test clear rules with realistic costs, and expect price to pass through watched levels.
Usage varies. Retracement usually describes a temporary move against a trend. Correction is often used more broadly for a decline or adjustment after a price move. Forex has no universal percentage threshold that distinguishes the two terms.
Yes. A downward trend can temporarily bounce upward. Traders may measure that bounce from the preceding low toward the high and compare resistance areas. It can also develop into a reversal, so continuation remains uncertain during the move.
RSI, moving averages and candlestick patterns can add momentum or trend context. They can also give false or overlapping signals because they use price data. Define testable rules rather than assuming several indicators together guarantee a reliable entry.
No universal percentage separates a retracement from a reversal. Examine important swings on your chosen timeframe and define the point that invalidates your setup. Neither 61.8% nor 78.6% establishes a reliable cutoff or guarantees that price will rebound.