


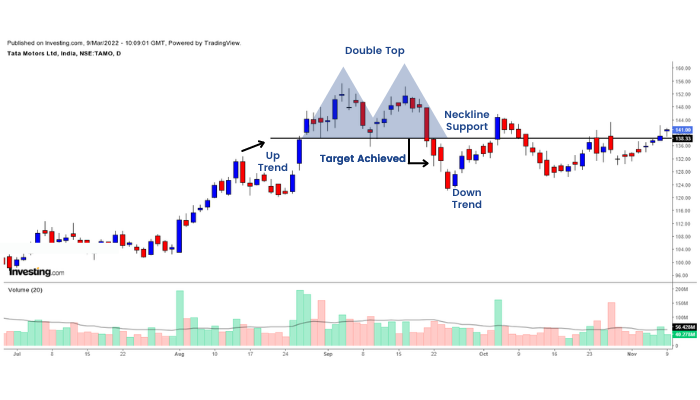
The double top pattern is one of the most reliable chart patterns for identifying potential reversals in the forex market. It’s easy to recognize because it looks like the letter “M.” This pattern forms when the price reaches a high point (the first peak), pulls back to a support level, and then attempts to climb again to the same high point (the second peak). When the price fails to break through the first peak and drops below the support level, the double top is confirmed.
This pattern is a favorite among traders because of its simplicity and effectiveness. It signals that buyers are losing control and sellers are gaining strength, which often leads to a downward trend. Whether you’re trading forex, stocks, or commodities, mastering the double top pattern can help you make smarter trading decisions.
In this guide, we’ll break down the double top pattern meaning, explain why it’s important, and show you how to trade it effectively. By the end, you’ll understand why this pattern is such a valuable tool for traders at all levels.
What is a Double Top Pattern?
The double top pattern is a technical chart formation that signals a potential reversal from an uptrend to a downtrend. It’s called a double top because it features two peaks (or “tops”) at nearly the same price level, separated by a pullback to a support zone. This creates an “M” shape on the chart.
Breaking Down the Double Top Pattern
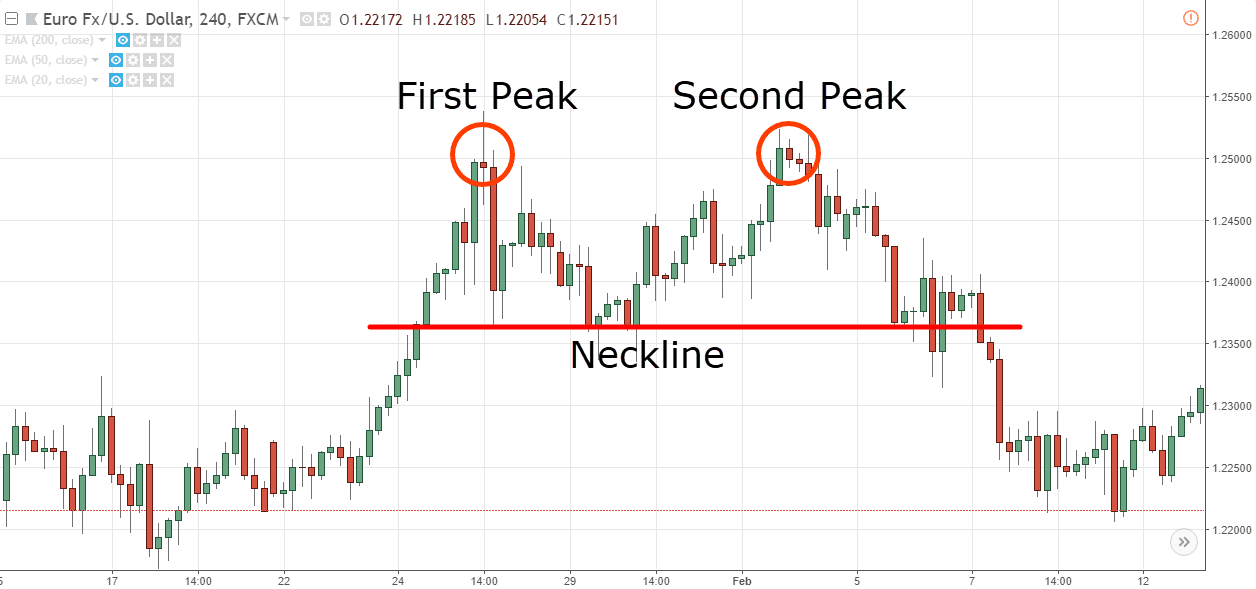
- First Peak (A): The price rises to a high point, showing strong buying momentum.
- Pullback (B): The price drops to a support level but does not fall below it.
- Second Peak (C): The price rises again but struggles to surpass the first peak, signaling weakening buying power.
- Breakout (D): The price breaks below the support level (neckline), confirming the pattern and suggesting a bearish reversal.
Double Top Pattern Meaning
This pattern indicates that buyers tried twice to push the price higher but failed. The repeated failure shows that sellers are gaining control, making it a strong signal for a downtrend.
Is a Double Top Bullish or Bearish?
The double top pattern is bearish because it shows that the market is struggling to maintain its upward momentum. After the second peak, sellers typically overpower buyers, causing the price to drop.
Key Characteristics of a Double Top
- The peaks are almost equal in height.
- The pullback creates a clear support level (neckline).
- The breakout below the neckline confirms the pattern.
Example: Imagine the EUR/USD pair is in an uptrend. The price reaches 1.2000 (first peak), pulls back to 1.1950 (support), and then rises again to 1.2000 (second peak). When the price falls below 1.1950, the double top is confirmed, and traders expect the price to decline further.
This simple yet effective pattern gives traders a clear signal to prepare for a bearish move, making it one of the most trusted tools in technical analysis.
How Does the Double Top Chart Pattern Work?
The double top chart pattern works by showing a clear loss of momentum in an uptrend. It reveals when buyers are struggling to push the price higher, leading to a shift in control toward sellers.
Let’s break it down step by step:
First Peak Formation
The price climbs to a high point, supported by strong buying momentum. At this stage, the market looks bullish, and traders expect the trend to continue.
Pullback to Support
After reaching the first peak, the price pulls back to a support level. This drop happens because some traders begin taking profits, creating a temporary slowdown in the uptrend. However, the support level holds, and buyers attempt to push the price back up.
Second Peak Formation
The price rises again, reaching nearly the same level as the first peak. But this time, the momentum is weaker. Buyers fail to push the price higher than the first peak, showing a loss of strength.
Breakout Below Support (Neckline)
When the price drops below the support level (called the neckline), the double top pattern is confirmed. This breakout signals that sellers are now in control, and the price is likely to continue downward.
Key Points to Remember
- The neckline (support level) is critical. A break below it confirms the pattern.
- Volume often decreases during the second peak, signaling a weakening trend.
- Once the breakout happens, the price typically falls by a distance equal to the height between the peaks and the neckline.
Example: Let’s say you’re analyzing the GBP/USD pair. The price climbs to 1.3500 (first peak), drops to 1.3450 (support), and then rises back to 1.3500 (second peak). After failing to break higher, the price falls below 1.3450, confirming the double top. The expected price target would be 1.3400, based on the height of the pattern.
Understanding how the double top chart pattern works gives traders a reliable framework for spotting trend reversals and preparing for bearish moves. By waiting for the breakout below the neckline, traders can enter with confidence and avoid false signals.
Why is the Double Top Pattern Important?
The double top pattern is one of the most important tools for traders because it helps identify when an uptrend is coming to an end. Recognizing this pattern early allows traders to prepare for a market reversal, which can save them from potential losses or open up new trading opportunities.
Key Benefits of the Double Top Pattern
Clear Reversal Signals: The double top provides a clear and visual signal that the trend is losing strength. When the second peak fails to break the first peak and the price drops below the neckline, traders have a strong indication that sellers are taking control.
Simple and Easy to Recognize: The double top’s “M” shape is simple to identify on a price chart. This makes it a beginner-friendly pattern that’s also trusted by experienced traders.
Works Across All Markets: This pattern isn’t limited to forex trading. It works well in stocks, commodities, and even cryptocurrencies, making it a versatile tool for all types of traders.
Provides Clear Entry and Exit Points: The double top pattern gives traders a clear plan:
- Entry Point: After the price breaks below the neckline.
- Stop-Loss Placement: Above the second peak to limit risk.
- Profit Target: A distance equal to the height of the pattern.
Common Mistakes to Avoid
Mistaking Small Pullbacks for a Double Top: A proper double top forms after a strong uptrend and has two distinct peaks. Be cautious of false patterns during choppy markets.
Entering Too Early: Entering before the price breaks below the neckline can lead to losses if the pattern fails. Always wait for confirmation.
Real-Life Importance
For example, let’s say EUR/USD is in an uptrend, and the price hits 1.2100 twice but struggles to go higher. If the price drops below 1.2050 (the neckline), the double top is confirmed. Traders can then prepare for a bearish move and avoid holding long positions that could result in losses.
By understanding why the double top pattern is important, traders can use it to make smarter, more informed decisions, protecting their profits and maximizing opportunities in the market.
How to Trade the Double Top Pattern?
The double top pattern is a powerful tool for identifying bearish reversals, but knowing how to trade it effectively is key. By following a structured approach, traders can take advantage of this pattern to make smarter trades and reduce risks.
Steps to Trade the Double Top Pattern
- Identify the Pattern: Look for the “M” shape on your chart, with two peaks at similar levels and a support line (neckline) in between. Ensure the pattern forms after a strong uptrend for it to be reliable.
- Wait for Confirmation: Never enter a trade based on two peaks alone. The pattern is only confirmed when the price breaks below the neckline, showing that sellers are in control.
- Set Your Entry Point: Enter the trade as soon as the price closes below the neckline. This is your signal that the bearish reversal is likely underway.
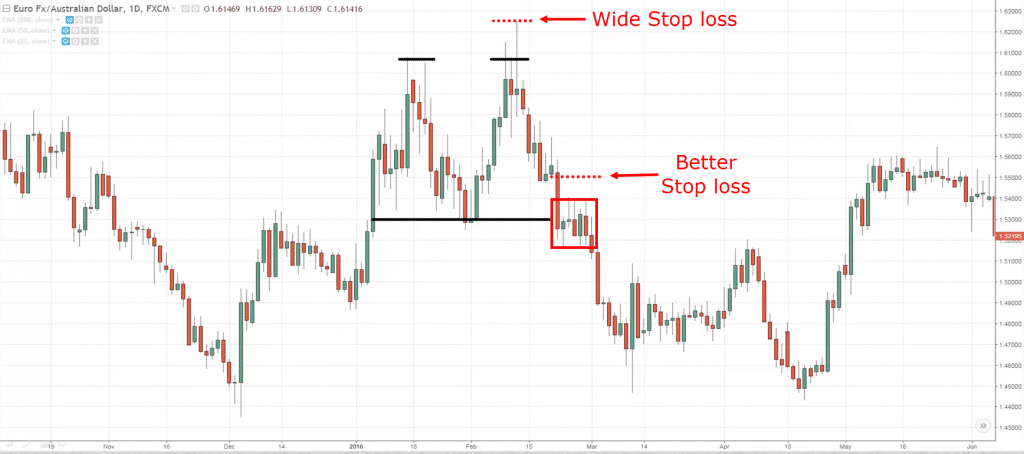
- Place a Stop-Loss: To protect yourself, place a stop-loss just above the second peak. This limits your losses in case the market moves against you.
- Determine Your Profit Target: Measure the distance between the peaks and the neckline. Use this height to set your profit target below the neckline.
Example Trade: Let’s say you’re trading USD/JPY, and you notice a double top forming at 145.00 with a neckline at 144.50. Here’s how you could trade it:
- Entry: Enter a sell trade when the price drops below 144.50.
- Stop-Loss: Place your stop-loss above the second peak at 145.10.
- Profit Target: The distance between the peaks and the neckline is 50 pips. Set your target at 144.00.
If the trade goes as planned, you’ll capture the 50-pip move and exit before the market stabilizes.
Pro Tips for Trading the Double Top
- Combine with Other Indicators: Use tools like RSI or MACD to confirm momentum loss before entering a trade.
- Be Patient: Avoid jumping in too early. Always wait for the breakout below the neckline to confirm the pattern.
- Practice Risk Management: Risk only a small percentage of your account on each trade, usually 1–2%.
By following these steps, traders can use the double top pattern to enter trades with confidence and precision, maximizing their chances of success.
Double Top vs. Other Chart Patterns
The double top pattern is a reversal pattern that stands out for its simplicity and effectiveness. However, it’s often compared to other popular chart patterns that also signal potential reversals or continuations.
Let’s take a closer look at how the double top differs from similar patterns:
Double Top vs. Head and Shoulders
The head and shoulders pattern also signals a bearish reversal, but it has three distinct peaks:
- The head (middle peak) is the highest.
- The shoulders (two side peaks) are lower and roughly equal in height.
Why Choose the Double Top?
- Easier to spot because it has only two peaks.
- Forms more frequently, offering more trading opportunities.
Example: If the market forms two similar highs, it’s likely a double top. If the middle peak is taller, it’s a head and shoulders pattern.
Double Top vs. Triple Top
A triple top pattern has three peaks at the same resistance level instead of two. It signals the market’s inability to break above that level multiple times.
Why Choose the Double Top?
- Quicker to confirm because it requires only two peaks.
- Offers faster signals for traders who want to act quickly.
Example: If the price creates two clear peaks and breaks the neckline, it’s a double top. If a third peak forms, it’s a triple top.
Double Top vs. Continuation Patterns
Unlike the double top, continuation patterns like flags or pennants signal the continuation of an existing trend rather than a reversal.
Why the Double Top Stands Out:
- It gives traders an early warning of a trend reversal, helping them prepare for a market shift.
- Continuation patterns require more confirmation and patience before acting.
Common Mistakes to Avoid When Trading the Double Top Pattern
Even though the double top pattern is straightforward, traders can still make mistakes that lead to losses. Avoiding these common errors can help you trade more effectively and confidently.
Entering Too Early
One of the biggest mistakes is jumping into a trade before the pattern is fully confirmed. Many traders enter after spotting two peaks, but this is risky. Without a breakout below the neckline, the price could continue upward, invalidating the pattern.
How to Avoid: Wait for the price to break and close below the neckline before entering your trade.
Ignoring Volume Analysis
Volume plays a crucial role in confirming the strength of a double top. If the volume is low during the second peak and increases during the breakout, it’s a stronger signal of a bearish reversal. Ignoring this can lead to false signals.
How to Avoid: Always check if the volume supports the pattern. Shrinking volume during the second peak and increasing volume during the breakout are good signs.
Placing Stop-Loss Too Tight
Some traders place their stop-loss too close to the neckline or second peak. This increases the chance of getting stopped out by minor price fluctuations before the trade moves in your favor.
How to Avoid: Place your stop-loss slightly above the second peak to give your trade enough room to breathe.
Confusing Similar Patterns
Beginners often mistake other patterns, like a double bottom or a small pullback, for a double top. Trading a false pattern can lead to unnecessary losses.
How to Avoid: Make sure the pattern has two distinct peaks, a support level (neckline), and a breakout below the neckline to confirm the double top.
Overlooking the Bigger Picture
Focusing too much on the double top and ignoring the overall market trend can be risky. For example, a strong bullish trend might invalidate the bearish reversal.
How to Avoid: Analyze the broader market trend and combine the double top with other indicators like RSI or moving averages for confirmation.
Conclusion
The double top pattern is one of the most reliable tools for spotting bearish reversals in the forex market. Its simple “M” shape makes it easy to identify, even for beginners. By understanding how it works and waiting for confirmation through a break below the neckline, traders can avoid false signals and make more confident decisions.
This pattern isn’t just about spotting reversals—it’s also a way to improve your timing and risk management. When combined with tools like volume indicators, RSI, or moving averages, the double top pattern becomes even more powerful.
Having the right broker is just as important as using the right strategy. Defcofx supports traders with low spreads starting from 0.3 pips, high leverage up to 1:2000, and fast withdrawals processed in just 4 business hours. With a 40% welcome bonus and 24/7 multilingual support, Defcofx is an excellent partner for traders using technical patterns like the double top.
By practicing this strategy and following a clear plan, you can make smarter trades and build confidence in your skills. The double top is a proven way to improve your trading game.
FAQs
What is a double top chart pattern?
The double top chart pattern is a bearish reversal pattern with two peaks at the same level and a neckline that signals the breakout.
Is a double top bullish or bearish?
A double top is bearish because it shows that buyers failed to push the price higher twice, leading to a downward trend.
How do I confirm a double top pattern?
You confirm it when the price breaks and closes below the neckline, which is the support level between the two peaks.
Can beginners use the double top pattern?
Yes, the double top pattern is beginner-friendly because of its simple shape and clear signals.
Why is Defcofx a good broker for trading patterns?
Defcofx offers low costs, high leverage, fast withdrawals, and excellent support, making it a reliable choice for traders using technical strategies.
Top Forex Reads for You
Looking for interesting Forex content? Stay engaged with Defcofx and dive into these top selections: