


Money flow refers to the net movement of capital into or out of an asset, market, or sector. It is calculated by combining price action with trading volume. Positive money flow means more money is entering an asset (bullish signal). Negative money flow means more money is leaving (bearish signal).
Key Takeaways
- Money flow tracks whether buyers or sellers are in control based on price direction and volume.
- The Money Flow Index (MFI) is the most common technical indicator derived from this concept, often called the “volume-weighted RSI.”
- Positive money flow and rising prices confirm an uptrend. Divergences between price and money flow often signal potential reversals.
- Money flow is used across forex, stocks, commodities, crypto, and indices.
- At Defcofx, you can trade all major asset classes where money flow analysis applies, with spreads from 0.3 pips and leverage up to 1:2000.
What Does Money Flow Mean in Trading?
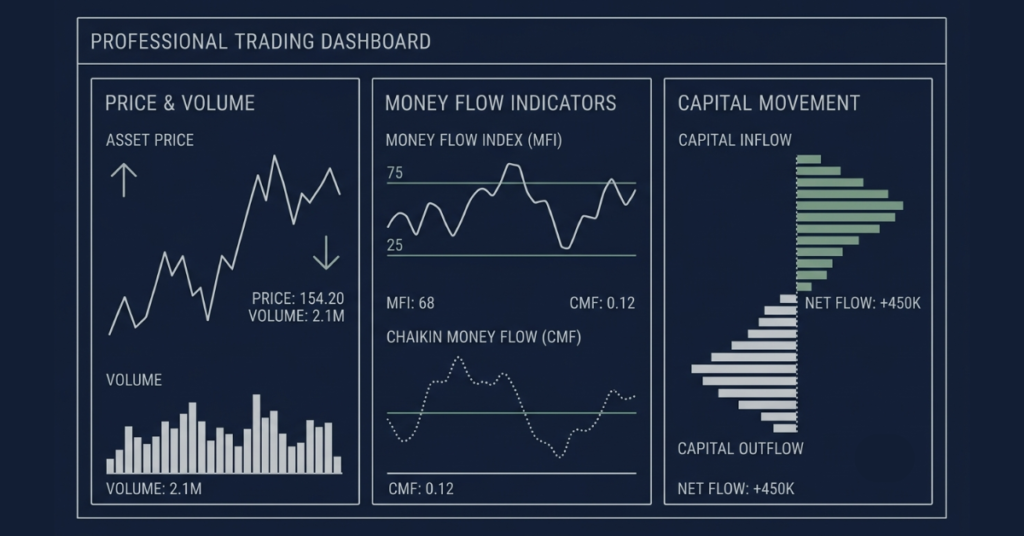
At its core, money flow is about understanding where the “smart money” is going. It is a volume-based concept: when large volumes of buying happen on up-candles, money is flowing in. When large volumes of selling happen on down-candles, money is flowing out.
This matters because price alone can sometimes be deceptive. A price rise on low volume is weak; it does not represent sustained interest. But a price rise accompanied by heavy volume and positive money flow signals that strong buying pressure is backing the move.
Money flow is relevant across all markets. Whether you are tracking gold vs forex, stocks, or crypto, the principle remains the same: follow the capital.
How Is Money Flow Calculated?
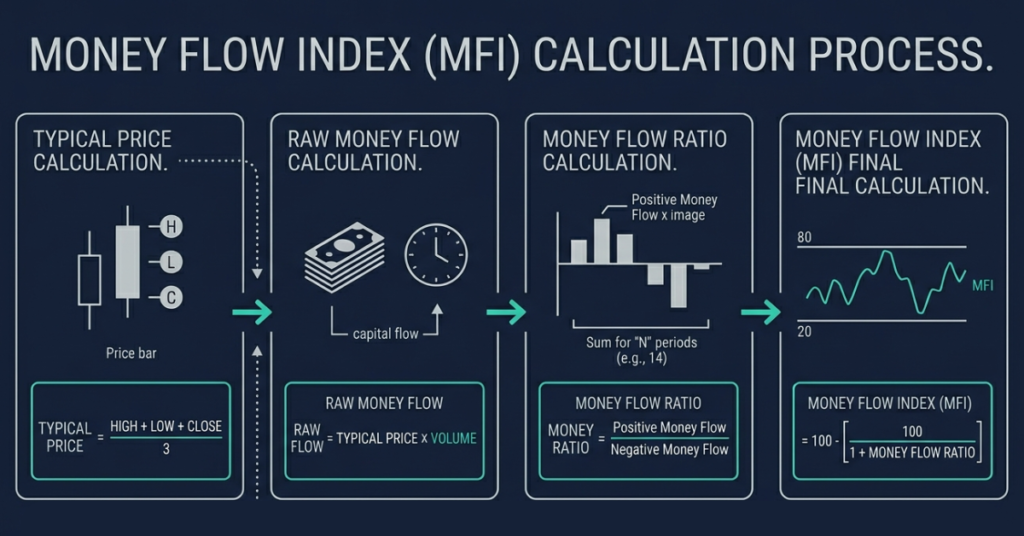
The calculation behind money flow involves a few simple steps:
- Typical Price: (High + Low + Close) / 3
- Raw Money Flow: Typical Price × Volume for that period
- Compare Typical Price to previous period. If higher: Positive Money Flow. If lower: Negative Money Flow.
- Money Flow Ratio: Positive Money Flow / Negative Money Flow over N periods (typically 14)
- Money Flow Index (MFI): 100 – (100 / (1 + Money Flow Ratio))
The output is a number between 0 and 100. Values above 80 suggest overbought conditions, while values below 20 suggest oversold conditions similar to the RSI, but with volume factored in.
Types of Money Flow Indicators
1. Money Flow Index (MFI)
The MFI is the most widely used money flow indicator. It is an oscillator that moves between 0 and 100 and incorporates both price and volume. Because it uses volume, it gives a more complete picture of market dynamics than price-only indicators like RSI.
Traders look for:
- MFI above 80: overbought, potential reversal or pullback.
- MFI below 20: oversold, potential bounce or trend reversal.
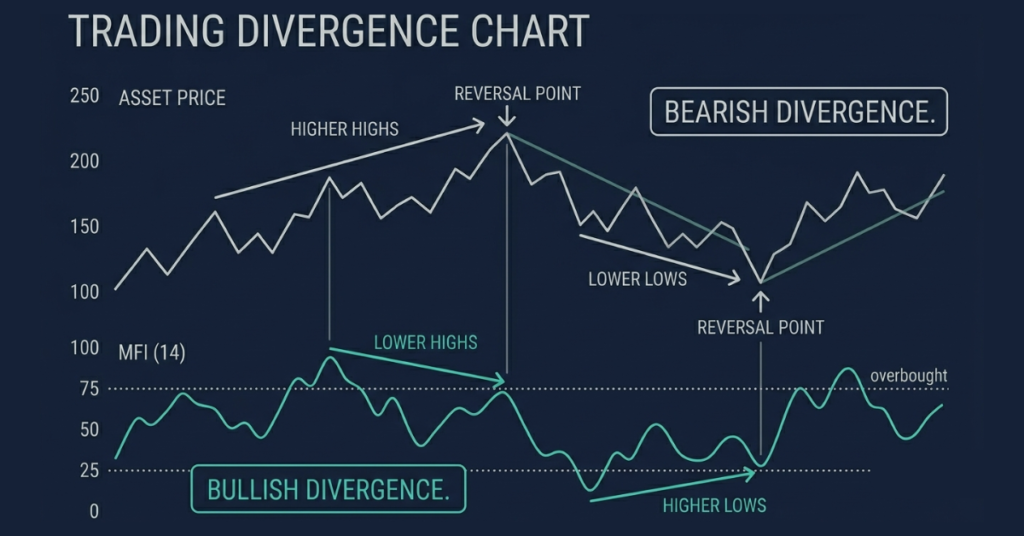
- Divergence: price makes new high but MFI does not, suggesting the rally is weakening.
2. Chaikin Money Flow (CMF)
The Chaikin Money Flow is another volume-based indicator that measures buying and selling pressure over a set period, typically 20 or 21 days. It oscillates above and below zero. A sustained positive reading above zero suggests buying pressure is dominating; a negative reading suggests selling pressure.
CMF is particularly useful for confirming trend direction in combination with price action signals like breakouts or trend line tests.
3. On-Balance Volume (OBV)
OBV is a simpler cumulative indicator. It adds volume on up-days and subtracts volume on down-days. The resulting line shows whether volume is trending in the same direction as price. If the price is rising but OBV is flat or declining, the trend may not be sustainable.
4. Accumulation/Distribution Line (A/D Line)
The A/D line is similar to OBV but also accounts for where the close falls within the daily range. If a stock closes near its high on heavy volume, that adds a lot to the accumulation reading. If it closes near its low, it adds to the distribution reading.
Open a Live Trading AccountHow Traders Use Money Flow in Practice
Confirming Breakouts
When price breaks above a key resistance level, a simultaneous surge in the MFI or CMF confirms that capital is genuinely backing the move. Without that volume and money flow confirmation, many breakouts fail. This is a core concept in day trading patterns and swing trading alike.
Spotting Divergences
When price makes a new high but the money flow indicator makes a lower high, this divergence is a warning signal. It suggests that the rally is not being backed by strong buying volume, and a reversal may be coming. The reverse also applies on downtrends.
Divergence is a concept used widely in technical analysis. If you already use RSI or MACD for your forex trading strategies, adding money flow divergence as a confirmation layer can sharpen your entries and exits.
Identifying Institutional Activity
Retail traders cannot easily track what institutions are doing. But unusual spikes in money flow, particularly when price is moving sideways, can indicate that large players are quietly accumulating or distributing positions. This is sometimes called “smart money” activity.
Sector and Market Rotation
Money flow analysis is not just for individual instruments. At a macro level, traders and analysts track which sectors or asset classes are seeing capital inflows versus outflows. When money flows out of defensive stocks and into technology or commodities, it signals a shift in risk appetite.
Money Flow vs. Other Volume Indicators
| Indicator | Uses Volume? | Key Strength |
| MFI | Yes | Overbought/oversold with volume weight |
| RSI | No | Momentum oscillator, no volume context |
| CMF | Yes | Buying/selling pressure over time |
| OBV | Yes | Cumulative volume trend confirmation |
| A/D Line | Yes | Measures accumulation vs. distribution |
For a broader view of which indicators to combine with money flow, the top 20 trading indicators guide covers the most widely used tools across all asset classes.
Does Money Flow Work in Forex?
This is a common question, and the honest answer is: forex money flow is more complex than equity money flow. Unlike stocks, forex is a decentralized market with no central exchange reporting official volume. The volume data you see on MT5 for a forex pair is “tick volume” the number of price changes in a period not actual traded volume in dollar terms.
That said, tick volume is highly correlated with actual volume in the forex market, making indicators like MFI and OBV still useful when applied to major pairs.
Forex traders who also track commodities like gold can use real volume data from futures markets as a proxy. You can learn more about cross-market dynamics on the market analysis page.
Common Mistakes Traders Make with Money Flow
Using It in Isolation
Money flow indicators work best as confirmation tools, not standalone signals. An MFI reading of 85 does not guarantee a reversal; it just means the market is stretched. Combine it with price structure, support and resistance, and other indicators before acting.
Misreading Low-Volume Markets
In thin markets, like during holidays or the Asian session for certain pairs, low volume can distort money flow readings. A small trade in a quiet market can send OBV sharply in one direction without reflecting true institutional participation.
Ignoring Timeframe Context
Money flow on a 1-minute chart tells you something different from money flow on a daily chart. Most swing traders focus on daily or 4-hour charts for trend context, while day traders might use 15-minute or 1-hour readings. Refer to the best technical indicators for swing trading for guidance on timeframe-appropriate setups.
Trade Smarter with Money Flow Analysis at Defcofx
Defcofx gives you access to all the tools needed to apply money flow analysis across multiple asset classes: forex pairs, metals, indices, energies, and crypto. MetaTrader 5 includes built-in volume and money flow indicators, and the platform runs on both desktop and mobile.
| Feature | Defcofx Detail |
| Platform | MetaTrader 5 (MT5) |
| Leverage | Up to 1:2000 |
| Spreads | From 0.3 pips |
| Commissions | Zero |
| Swap Fees | Zero |
| Welcome Bonus | 40% on first deposit of $1,000+ |
| Withdrawals | Within 4 business hours, weekends included |
You can also access the market heat maps to visually track capital flow direction across instruments in real time.
Final Thoughts on Money Flow and Market Direction
Money flow is one of the most valuable concepts traders can use to understand what is happening beneath price movements. While price tells you where the market is moving, money flow helps explain the strength behind that move by incorporating volume and participation. When rising prices are supported by strong positive money flow, trends tend to be more sustainable. When price and money flow diverge, traders often receive an early warning that momentum is weakening and a reversal may be approaching.
The key advantage of money flow analysis is that it helps traders move beyond price-only decision-making. Indicators such as the Money Flow Index (MFI), Chaikin Money Flow (CMF), On-Balance Volume (OBV), and the Accumulation/Distribution Line can provide valuable confirmation for breakouts, trend continuations, and potential reversals. However, like all technical tools, money flow indicators should never be used in isolation. The strongest trading decisions come from combining money flow analysis with price action, trend structure, support and resistance levels, and sound risk management.
FAQ
Money flow is a way to measure whether more money is entering or leaving an asset. It combines price direction and trading volume to determine if buyers or sellers are in control. Positive money flow is bullish, negative money flow is bearish.
The MFI is an oscillator between 0 and 100 that measures buying and selling pressure using both price and volume data. Readings above 80 are considered overbought, and below 20 are oversold. It is also called the “volume-weighted RSI” because of its structural similarity to the Relative Strength Index.
RSI measures price momentum based on recent closing prices alone. The MFI adds volume to the equation, making it a more complete picture of market strength. A price move with strong volume backing will register more strongly in the MFI than in the RSI.
Money flow indicators are generally considered coincident to slightly leading indicators. Divergences between money flow and price can anticipate reversals before they happen, which gives them a mild leading quality. However, no indicator predicts the future with certainty.
Yes. While forex lacks centralized volume data, tick volume on platforms like MT5 is a good proxy. MFI and OBV can be applied to any forex pair on any timeframe. For best results, combine them with other technical tools found in the best technical indicators for forex guide.
Negative money flow means the typical price of an asset was lower than the previous period, and the volume on those down moves was significant. It indicates that sellers are dominating and that capital is leaving the asset, which can confirm a downtrend or signal a weakening uptrend.