


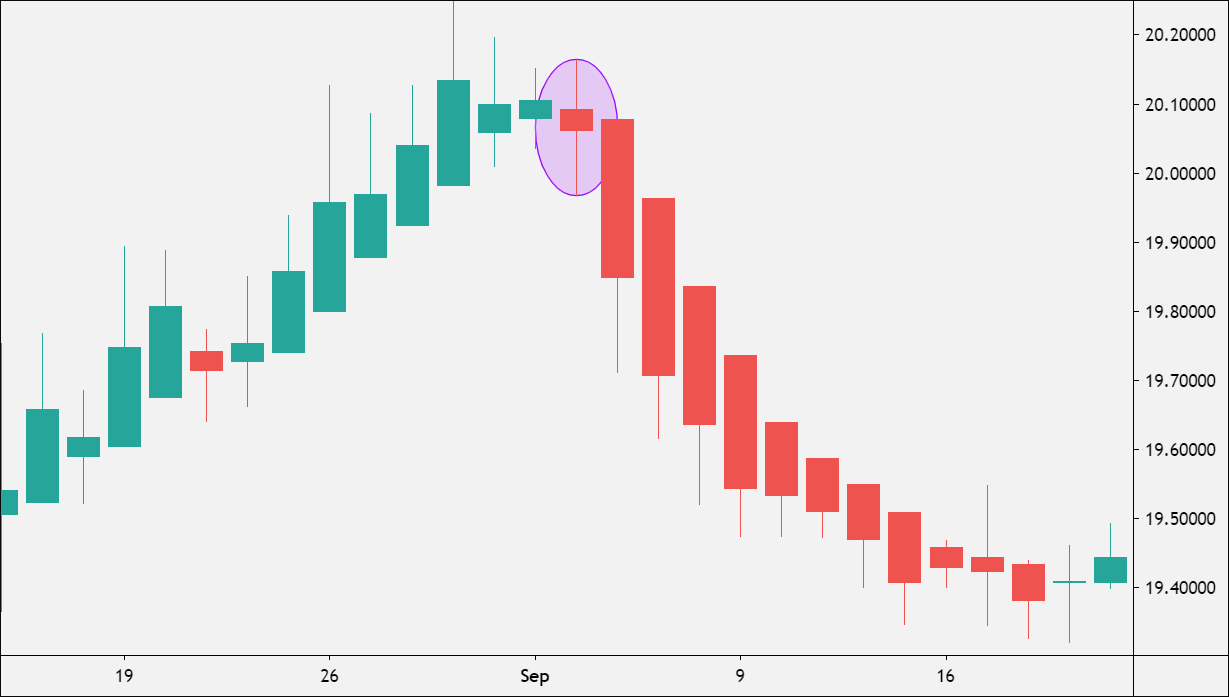
Candlestick patterns help day traders identify possible market reversals, trend continuations, and precise entry points. Widely used patterns like the hammer, engulfing candle, doji, morning star, and shooting star reveal how buyers and sellers behaved during a specific time period. They work across forex, gold, stocks, and crypto and are most effective when combined with support and resistance levels, market context, and proper risk management.
Key Takeaways
- Candlestick patterns reveal market psychology, showing who controlled price and whether momentum is shifting
- Reversal patterns signal a potential change in trend direction; continuation patterns suggest the existing trend will resume
- Single-candle patterns like the hammer and shooting star work, but multi-candle patterns like engulfing and morning star tend to give stronger signals
- Confirmation from the next candle is essential before entering any trade based on a pattern
- Candlestick patterns become significantly more powerful when they form at key support or resistance levels
- Always combine patterns with proper risk management, no pattern is correct 100% of the time
What Are Candlestick Patterns?
Candlestick patterns are visual formations on price charts that show how buyers and sellers behaved during a specific trading period. Every individual candle on a chart displays four key pieces of information: the opening price, closing price, the highest price reached, and the lowest price reached during that period.
The body of the candle shows the range between open and close, while the wicks (also called shadows) above and below show the full extent of price movement. The size and position of the body and wicks together tell a story about market sentiment.
Day traders use these formations to understand market psychology and anticipate future price direction. A long lower wick, for example, shows that sellers pushed price down but buyers rejected those lows and pushed it back up. That single piece of information, visible on the chart at a glance, is what makes candlestick analysis so powerful.
Why Candlestick Patterns Matter in Day Trading
Day trading depends heavily on timing. Because positions are opened and closed within the same session, traders need tools that quickly signal market direction, momentum shifts, and potential reversals without delay.
Candlestick patterns serve this purpose better than many lagging indicators because they are based entirely on actual price action, what the market is doing right now, not what it did several periods ago.
Rather than waiting for a moving average crossover or an RSI reading to catch up, a trader reading candlestick patterns can see a shift in momentum the moment it happens. Combining this with technical indicators like RSI or moving averages adds a layer of confirmation that improves the quality of entries.
Complete Candlestick Pattern Reference Table
The table below covers the most commonly used candlestick patterns in day trading, organized by type and signal. Green rows are bullish, red are bearish, and yellow indicate neutral or indecision patterns.
| Pattern | Type | Signal | Candles |
| Hammer | Bullish Reversal | Sellers rejected, buyers take over | 1 |
| Inverted Hammer | Bullish Reversal | Possible buying interest forming | 1 |
| Bullish Engulfing | Bullish Reversal | Buyers dominate previous candle | 2 |
| Morning Star | Bullish Reversal | Strong buying momentum returns | 3 |
| Piercing Line | Bullish Reversal | Buyers push back above midpoint | 2 |
| Shooting Star | Bearish Reversal | Buyers rejected at highs | 1 |
| Bearish Engulfing | Bearish Reversal | Sellers dominate previous candle | 2 |
| Evening Star | Bearish Reversal | Strong selling momentum returns | 3 |
| Dark Cloud Cover | Bearish Reversal | Sellers push back below midpoint | 2 |
| Hanging Man | Bearish Reversal | Selling pressure emerging | 1 |
| Doji | Neutral/Indecision | Buyers and sellers balanced | 1 |
| Spinning Top | Neutral/Indecision | Weakening momentum signal | 1 |
| Rising Three Methods | Continuation | Trend pauses then resumes up | 5 |
| Falling Three Methods | Continuation | Trend pauses then resumes down | 5 |
Hammer and Inverted Hammer
The hammer is a bullish reversal pattern that appears after a downtrend. It has a small body near the top of the candle and a long lower wick, showing that sellers drove the price sharply lower during the session but buyers stepped in and pushed it back up before the close. This rejection of lower prices is the signal.
The longer the lower wick relative to the body, the more significant the rejection. A hammer at a well-established support level or after a prolonged downtrend carries considerably more weight than one appearing after a minor two-candle dip.
The inverted hammer has the same setup in reverse, a small body near the bottom with a long upper wick. While buyers tried to push price up and were rejected, this pattern can still be bullish if it appears at the end of a downtrend. Both patterns require the next candle to close higher before being confirmed as valid entries. Read more at inverted hammer candlestick.
Bullish and Bearish Engulfing Patterns
Engulfing patterns are among the most reliable reversal signals in day trading because they represent a complete takeover by one side of the market.
- A bullish engulfing pattern forms when a large bullish candle completely covers (engulfs) the body of the previous bearish candle. This shows that buyers were not just matching sellers, they overwhelmed them. The larger the engulfing candle relative to the one before it, the stronger the signal.
- A bearish engulfing works in the opposite direction. A large bearish candle covers the previous bullish candle, showing sellers have taken control. When these patterns appear at the right locations, bullish engulfing at support, bearish engulfing at resistance, they are considered some of the highest-probability setups in candlestick trading.
You can also explore related patterns like outside bars in forex trading, which share similar structural logic with engulfing patterns.
Doji Patterns: Reading Market Indecision
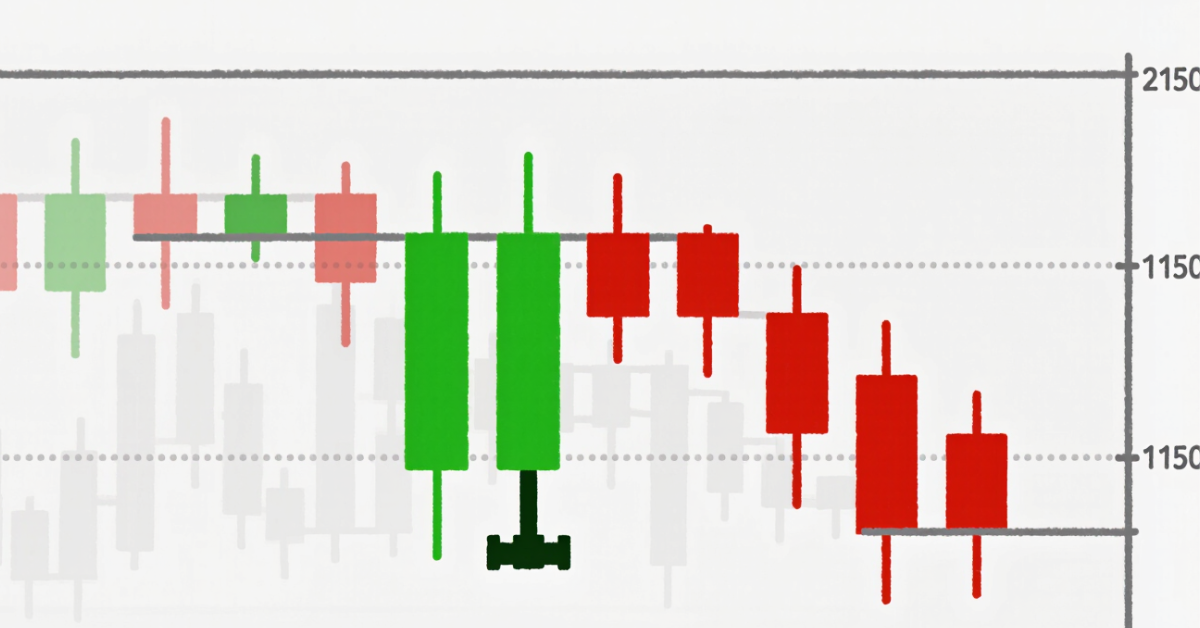
The doji forms when the opening and closing prices are almost identical, creating a very small or non-existent body. The wicks can vary in length. What the doji communicates is that buyers and sellers fought to a standstill during the period, neither side won.
A single doji in isolation is not a trading signal. However, in context it becomes very useful. A doji appearing after a strong uptrend signals that momentum is stalling. Buyers could not push price higher. This is a warning, not a trigger.
Common doji variations include the standard doji, long-legged doji (long wicks in both directions), gravestone doji (long upper wick, no lower wick), and dragonfly doji (long lower wick, no upper wick). Each carries a slightly different connotation, but all represent the same core idea: a battle between buyers and sellers with no decisive winner.
Morning Star and Evening Star
Three-candle patterns provide stronger signals than single candles because they show a more complete story of market sentiment shifting over multiple sessions.
- The morning star is a bullish reversal pattern that usually appears at the bottom of a downtrend. It consists of a large bearish candle, followed by a small-bodied or doji candle showing indecision, followed by a large bullish candle that closes well into the body of the first candle. The pattern represents sellers losing control, a period of uncertainty, and then buyers firmly taking over.
- The evening star is the bearish mirror of the morning star. It appears at the top of an uptrend and signals the same shift in momentum, this time from buyers to sellers. These patterns are particularly effective on the 1-hour and 4-hour charts used by day and swing traders.
Shooting Star and Hanging Man
- The shooting star is the bearish equivalent of the hammer. It has a small body near the bottom of the candle with a long upper wick, showing that buyers pushed the price strongly higher during the session but sellers rejected those highs and pushed it back down. When this appears after an uptrend, it is a warning that the rally may be running out of steam.
- The hanging man looks almost identical to a hammer (small body, long lower wick) but appears at the top of an uptrend rather than at the bottom. The key difference is context. The long lower wick in this position shows that sellers were active and created downside pressure even during what appeared to be a bullish session.
Reversal Patterns vs Continuation Patterns
Understanding the difference between reversal and continuation patterns is critical to knowing how to use them correctly.
| Feature | Reversal Patterns | Continuation Patterns |
| Purpose | Predict a change in trend direction | Confirm the existing trend will resume |
| Risk Level | Higher, counter-trend entries | Moderate, trend-aligned entries |
| Best Use | Near strong support or resistance levels | During established trends with clear momentum |
| Confirmation Needed | Yes, always wait for next candle close | Yes, volume and context still matter |
| Examples | Hammer, Engulfing, Morning Star | Rising Three Methods, Bull Flag, ABCD |
Which Timeframes Work Best?
Candlestick patterns are used across all timeframes, but day traders tend to focus on specific ones depending on their style.
- 1-minute and 5-minute charts: Used by scalpers for very short-term entries. Patterns can form and resolve within minutes but generate more noise
- 15-minute chart: A popular balance between speed and signal quality. Many day traders use this as their primary execution chart
- 1-hour chart: Better signal quality, fewer false setups. Used by intraday swing traders looking for larger moves
- 4-hour chart: More reliable patterns with cleaner structure, though setups are fewer. Good for confirmation of daily bias
How to Combine Candlestick Patterns with Other Tools
Candlestick patterns work best when they are one part of a broader analysis framework, not the only tool being used.
- Support and resistance: A hammer at a key support level is far more significant than a hammer in open space. Always check whether the pattern is forming at a price level that the market has historically respected.
- Trend direction: Reversal patterns are stronger when they align with a potential return to the major trend. A bullish engulfing in an overall uptrend is a trend continuation setup, not just a reversal of a minor pullback.
- RSI divergence: When price makes a new low but RSI does not follow, this divergence combined with a bullish candlestick pattern creates a compelling case for a reversal.
- Volume: Higher volume on the pattern candle adds conviction. A bullish engulfing on double the average volume carries more weight than one on below-average volume.
5 Common Mistakes When Using Candlestick Patterns
- Trading every pattern without confirmation: Entering a trade the moment a pattern appears, before the next candle confirms it, is one of the most consistent causes of false entries
- Ignoring market context: A bullish hammer in the middle of a strong downtrend is fighting the larger market direction. Always check the higher timeframe first
- Overtrading: Spotting a pattern does not mean you must trade it. Selectivity and patience consistently outperform high-frequency pattern chasing
- Using patterns on illiquid pairs: On thinly traded instruments, candlestick patterns can be unreliable because single large orders can create misleading wicks or bodies without real market sentiment behind them
- No defined stop loss: Every candlestick trade should have a clear invalidation level. For a hammer, that is typically below the low of the hammer candle itself
Candlestick Patterns Across Markets
One of the most practical advantages of candlestick analysis is that it works across all markets that display price in candle format.
- Forex: Candlestick patterns are widely used on major, minor, and exotic pairs. They work especially well on liquid pairs during active sessions
- Gold (XAU/USD): Gold is known for clean, well-defined candlestick patterns due to its trending nature and strong global participation. Reversal patterns at key gold price levels attract significant attention
- Stocks and indices: Engulfing patterns and dojis at earnings gaps or major moving averages on stock charts have strong precedent
- Crypto: Candlestick patterns apply to cryptocurrency charts, though the higher noise levels mean confirmation is even more important
Trade Candlestick Setups with Defcofx
Defcofx is an online forex and CFD broker running on MetaTrader 5 (MT5), giving you access to real-time candlestick charts across forex, gold, indices, stocks, and cryptocurrencies. MT5 includes all major chart types, built-in technical indicators, and customizable timeframes so you can analyze patterns on whatever frame suits your strategy.
- Real-time charting on MT5 with all candlestick types and full indicator library. Learn.
- Spreads from 0.3 pips so your entries are not eaten up by transaction costs on fast-moving pattern setups
- Up to 1:2000 leverage with negative balance protection
- 40% welcome bonus on first deposits of $1,000 or more. See the promotion page
- Demo account available so you can practice pattern recognition and entries at zero risk before trading live
- Access daily technical analysis and market news to stay informed on the context behind every pattern you see
Practice Candlestick Trading Risk-Free
Open a demo account and start recognizing patterns on live charts across forex, gold, and indices. When you are ready to trade live, Defcofx gives you tight spreads and fast execution.
Frequently Asked Questions
What is the best candlestick pattern for day trading?
There is no single best pattern, but bullish and bearish engulfing patterns are among the most reliable because they show a complete shift in market control. Morning star and evening star patterns are also highly regarded because they provide three-candle confirmation of a sentiment change.
Are candlestick patterns accurate?
No pattern is accurate 100% of the time. Accuracy improves significantly when patterns appear at key support or resistance levels, are confirmed by the following candle, and align with the broader trend or market context.
Can beginners learn candlestick trading?
Yes. Candlestick patterns are visual and learnable relatively quickly. The harder part is learning when not to trade a pattern, which comes with screen time and practice. Start with a demo account and review the forex trading checklist before going live.
Which timeframe is best for candlestick day trading?
Most day traders use the 15-minute or 1-hour chart for candlestick analysis. These timeframes offer a good balance between signal frequency and reliability. Shorter charts like the 1-minute and 5-minute generate more patterns but also more noise.
What is a bullish engulfing pattern?
A bullish engulfing pattern forms when a large bullish candle completely covers the body of the previous bearish candle. It signals that buyers have overwhelmed sellers and a reversal or strong continuation higher may follow, especially when it appears at a support level.
Do candlestick patterns work in forex?
Yes. Candlestick patterns are among the most widely used tools in forex trading because they reflect pure price action and market psychology. They work on all major, minor, and exotic pairs across any timeframe.
Can candlestick patterns be used for gold trading?
Yes. Gold (XAU/USD) often displays clear, well-defined candlestick patterns because of its strong trending nature and high global participation. Reversal patterns at major support and resistance levels on gold charts are closely watched by traders worldwide.
Should I use indicators with candlestick patterns?
Yes. Combining candlestick patterns with indicators like RSI, moving averages, or the ATR for volatility assessment adds confirmation and reduces false signals. See best technical indicators for forex for a practical guide.
What is the difference between a hammer and a hanging man?
Both patterns have the same shape, a small body and long lower wick, but their location determines their meaning. A hammer appears at the bottom of a downtrend and is bullish. A hanging man appears at the top of an uptrend and is a bearish warning signal.
How do I confirm a candlestick pattern before entering a trade?
The most common confirmation method is to wait for the candle that follows the pattern to close in the expected direction. For a hammer, that means waiting for the next candle to close bullishly above the hammer’s close. This prevents entering on patterns that immediately fail.
Start Identifying High-Quality Patterns on Defcofx Charts
Get access to real-time MT5 charts, a full indicator suite, and live pricing across 100+ instruments. Practice on the demo, then trade live when your strategy is ready.