


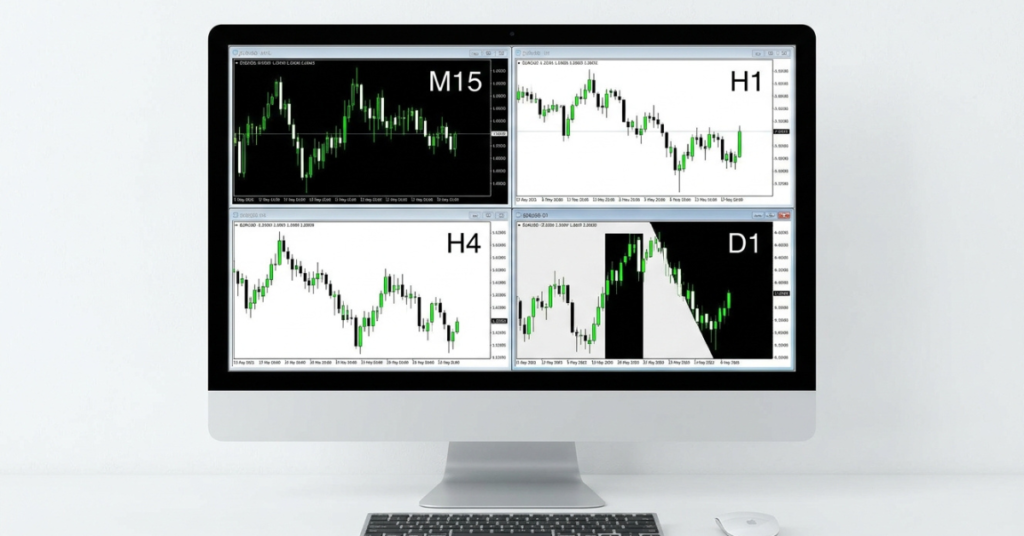
No single forex time frame is the most profitable. Results depend on a tested strategy, trading costs, risk management and consistent execution. H1 and H4 charts can suit traders who want fewer decisions than minute charts, but the best choice depends on their schedule and evidence from testing.
Key Takeaways
- The chart does not make money, the strategy does. A timeframe choice does not prove that a trading system has an edge.
- Trading costs can take a larger share of small targets. A 1-pip spread is 20% of a 5-pip target but 1.25% of an 80-pip target; the chart interval alone does not determine costs.
- Lower time frames display more short-term fluctuations. The usefulness of a signal depends on the strategy, liquidity and market conditions.
- H1 and H4 can fit some part-time schedules; setup frequency depends on the strategy and market.
- Consider testing a multiple-timeframe approach. A higher chart for context and a lower chart for entry is one approach to test, not a guarantee of better timing.
Why “Most Profitable” Is the Wrong Question
Every time frame shows the same market. A 4-hour candle is just 48 five-minute candles rolled into one. That aggregation does not, by itself, establish a trading edge. What changes between time frames is three things: how much noise you see, how much you pay in costs compared to your target, and how much of your time the trading takes.
The most profitable time frame is the one where your strategy has a positive expectancy after costs, and where you can actually follow your rules without getting tired or emotional. For a full-time trader, that might be the 15-minute chart. For someone with a day job, it is often the 4-hour or daily chart.
| Info: Chart labels in MetaTrader 5 MT5 names time frames by letter and number: M1 is 1 minute, M5 is 5 minutes, M15 is 15 minutes, H1 is 1 hour, H4 is 4 hours, D1 is daily and W1 is weekly. Our guide on M1, M5 and M15 in forex explains each one. |
Forex Time Frames Compared: The Matrix
This comparison gives illustrative trading styles and time commitments. These are examples, not profitability rankings or fixed requirements.
| Time frame | Trading style | Noise level | Typical hold | Setups per week | Screen time |
| M1 to M5 | Scalping | Very high | Seconds to minutes | Dozens | Constant |
| M15 to M30 | Day trading | High | 30 min to a few hours | 10 to 20 | Several hours a day |
| H1 | Intraday swing | Moderate | Hours to 1 day | 5 to 10 | 1 to 2 hours a day |
| H4 | Swing trading | Low | 1 to 5 days | 2 to 5 | 30 minutes a day |
| D1 | Position swing | Very low | Days to weeks | 1 to 3 | A few minutes a day |
| W1 | Position trading | Minimal | Weeks to months | Rare | Weekly review |
The setup counts, holding periods and screen-time figures are illustrative examples, not measured averages. They depend on strategy, instruments, session and market conditions.
The Hidden Cost Math Behind Each Time Frame
This is the part most beginners miss. Crossing the bid/ask spread creates a trading cost. If a strategy uses smaller targets, the same spread represents a larger share of that target.
For a simplified illustration, compare a hypothetical 5-pip target with an 80-pip target. These targets are not typical values or recommendations for M5 and H4.
| Spread | Cost on a 5-pip target (M5) | Cost on an 80-pip target (H4) |
| 1.0 pip | 20% of your target | 1.25% of your target |
| 0.5 pips | 10% of your target | 0.63% of your target |
A wider spread reduces net expectancy. The break-even win rate depends on average wins, average losses and total costs, not the time frame alone. Scalping requires an edge after total costs. A commission-based account can still be competitive if its all-in costs and execution are favorable. If you want to understand spreads better, read what a spread is in forex.
| Success tip: Compare all-in trading costs Lower all-in costs can improve net results, but do not create a trading edge. The examples assume a constant spread and exclude commissions, slippage and financing. Actual spreads can widen, especially around news and rollover. Avoid subtracting the spread twice if your test already uses bid and ask prices. |
The Case for Each Time Frame
1-minute and 5-minute charts (scalping)
Good for: Traders who can sit at the screen, react fast and follow strict rules.
The upside: More trades create more observations, but do not prove that an edge exists, and you rarely hold risk overnight.
The downside: Short-term fluctuations, execution costs and rapid decisions can be demanding. One news spike can wipe out a morning of small wins. See our 1-minute strategy guide and 5-minute trading guide if you want to try it.
15-minute and 30-minute charts (day trading)
Good for: Active traders who want several trades a day and to close out before bedtime.
The upside: These intervals can suit intraday setups. Active sessions may offer more movement, but movement does not guarantee that a strategy covers costs.
The downside: Still noisy, and you need to be available at the right hours. Pairing it with a 15-minute EMA setup is a popular approach.
1-hour chart for intraday analysis
Good for: Part-time traders who can check the charts a few times a day.
The upside: Fewer candles than on minute charts can make the broader structure easier to review. Target size and cost efficiency depend on volatility and the trading rules.
The downside: You may need to hold through a session change or overnight.
4-hour chart (swing trading)
Good for: Traders whose tested strategy and schedule suit fewer decisions; fewer trades are not necessarily better trades.
The upside: A full 24-hour trading day contains six H4 periods. Broker server time and session breaks affect candle boundaries. The larger interval can help you review broader trends and levels.
The downside: Fewer trades, and positions stay open for days. A 4-hour moving average is a simple starting tool.
Daily and weekly charts (position trading)
Good for: Patient traders who want to catch the big trends.
The upside: These charts aggregate intraday fluctuations and may suit less frequent reviews. Daily volatility changes substantially. Use current volatility and market structure rather than assuming a fixed daily range or target.
The downside: A setup may require a wider stop, which means a smaller position to keep monetary risk constant. Overnight news, weekend gaps and any applicable holding costs also need consideration.
Open Free Demo AccountPick Your Time Frame in 4 Questions
Answer these honestly and the right chart usually becomes obvious.
- How many hours a day can you watch the market? Less than 1 hour points to H4 or D1. Two to four hours suits H1 or M15. All day allows M5 or M15.
- How do you handle stress? If a fast red candle makes you panic, lower time frames will hurt your decisions. Higher charts give you time to think.
- How big is your account? Higher time frames need wider stops. With a small account, you must trade smaller lots to keep risk under control. Read our guide on position sizing.
- What does your backtest say? Test your strategy on at least two time frames over the same period. Compare results after costs, drawdown and sample size, then validate on unseen data to reduce the risk of choosing a timeframe that only fitted past noise. Our guide on backtesting shows how.
Multiple Time Frame Analysis: Getting the Best of Both
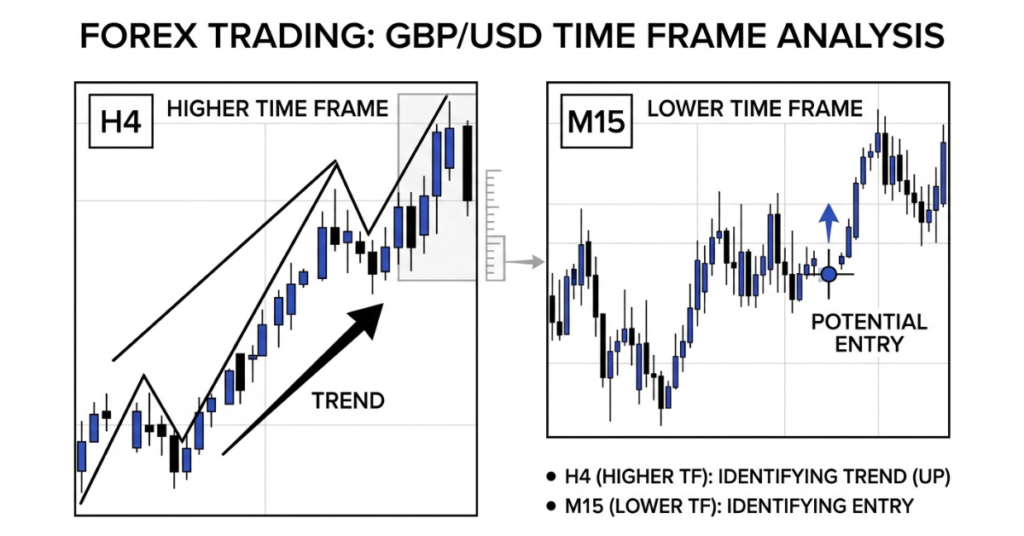
Some traders use a higher timeframe for context and a lower one for entries. The combinations below are examples, not a mandatory ratio or proof of how most professionals trade.
| Your main style | Trend chart | Entry chart |
| Scalping | M15 | M1 or M5 |
| Day trading | H1 | M15 |
| Swing trading | D1 | H4 or H1 |
| Position trading | W1 | D1 |
In a hypothetical example, a daily GBP/USD chart shows an uptrend. A trader then looks for a pullback on H4 and applies predefined entry, stop and exit rules. A bullish candle alone does not confirm a profitable trade. The illustration above uses H4 for context and M15 for entry, another possible combination.
Common Time Frame Mistakes
- Starting on the 1-minute chart. Faster candles do not imply higher profits. Beginners can compare H1 and H4 with shorter intervals on a demo account before choosing a tested approach.
- Using the same stop size on every chart. A fixed 10-pip stop may be unsuitable for the volatility and structure of another setup. Use the Average True Range to size stops for the chart you trade.
- Ignoring the trading session. A 15-minute chart during the quiet late Asian session behaves very differently from the London open. Check the best time to trade forex.
- Changing time frames after a few losses. Every time frame has losing streaks. Dozens of trades may still be an inadequate sample. Evaluate results across market regimes and account for dependence between trades, costs and out-of-sample performance.
Trade Every Time Frame With Defcofx
Defcofx offers MT5 and advertises the conditions below. They affect costs and platform access, but do not establish that any timeframe or strategy is profitable:
| Feature | Why it matters for your time frame |
| Spreads from 0.5 pips | A minimum quoted spread is not a fixed or average spread; check current bid/ask prices |
| Zero commissions | Reduces one component of cost; spreads and slippage still matter |
| Zero swap fees | Defcofx advertises swap-free trading; confirm current account and instrument conditions |
| Leverage up to 1:2000 on Silver and 1:500 on Gold | Account and instrument limits apply; leverage does not replace position sizing |
| MetaTrader 5 | 21 built-in time frames, from M1 to MN, with multi-chart layouts |
| 40% welcome bonus | For eligible new clients on their first deposit of $1,000 or EUR 1,000 or more; request and receive it before placing trades or orders, subject to current terms |
Not sure which approach suits you? Compare swing trading vs day trading or scalping vs swing trading, and see which trading strategy is most profitable for different personalities.
Open Live Trading AccountTest net expectancy before choosing a chart
Use net expectancy = (win rate × average win) − (loss rate × average loss), with wins and losses measured after trading costs. Compare drawdown, trade count and exposure as well as profit. Keep entry and exit rules fixed, reserve unseen data for validation and then forward-test on demo. For automated MT5 tests, use broker-provided real ticks where available and realistic execution assumptions. Historical and demo results do not guarantee live performance.
What do traders say about Defcofx?
Read customer experiences on Trustpilot and REVIEWS.io. Consider recent positive and negative feedback about execution, withdrawals and support alongside the broker’s published terms. Reviews do not establish strategy profitability.
Sources checked: Defcofx account specifications, welcome bonus terms, MT5 platform features and MT5 testing documentation. Account conditions may change before publication. Leveraged forex and CFD trading carries a risk of loss.
Final Thoughts on Which Forex Time Frame Is Most Profitable
There is no forex time frame that guarantees higher profits. Each chart simply presents the same market at a different level of detail, while the results come from the strategy, trading costs, risk management, and the trader’s ability to follow the rules consistently. A setup that works on H1 can be more useful than a faster strategy that generates constant noise on M1.
H1 and H4 can be practical options for traders whose tested rules and available time suit those intervals. Lower time frames can offer more opportunities but make spreads, execution, market noise, and emotional pressure more important. Higher time frames aggregate short-term fluctuations and may require fewer chart checks. If a setup uses a wider stop, reduce position size to keep monetary risk constant.
FAQ
Four-hour and daily charts can give beginners more time between decisions, but are not universally best. They have less noise, need less screen time and give you time to think before each decision. Once you are consistent there, you can try lower time frames.
The 1-hour chart can suit traders who review the market several times a day. Its usefulness depends on the strategy, trading session and costs. Test its results against other intervals rather than assuming it produces clearer or more profitable signals.
Profit is possible, but no result is guaranteed. Small targets can make spreads and slippage significant. A trader needs evidence of positive expectancy after costs, realistic execution assumptions and risk controls; a 1-minute chart alone provides no edge.
Professional approaches vary by mandate and strategy. Some use multiple timeframes, while others rely on a specific chart or non-chart data; there is no universal professional setup.
A 15-minute chart paired with a 1-hour chart is one possible day-trading setup. Its profitability depends on the tested entry and exit rules, spread and execution. Trading within the day does not ensure that price movement covers costs.
Not by itself. Target size and trade frequency depend on the strategy and volatility, not just the chart interval. Profit depends on your edge, costs and risk management on that chart.
Two or three can be a manageable starting point. One for the overall trend, one for the setup and, if needed, one for fine-tuning entries. More than three usually leads to confusion and mixed signals.